"Goal 4 -- Develop the Computational Methods and Capabilities to Advance Understanding of Complex Biological Systems and Predict their Behavior. "
Computational models on the edge of optimality
It is clear that detailed simulations of complex biological systems (e.g. protein folding, and full regulatory networks) are too computationally challenging and/or data-limited for the immediate future (the time period covered by this grant proposal). But there are great success stories in computational biology wherever the data are "overdetermined" (e.g. crystallography and genome sequencing). Our group has been dedicated for years to determining what data are needed for useful models and what methods are needed to obtain those data. Another aspect of computation biology that can be exploited is focusing on optimality, mimicking natural selection in order to predict cellular and population behavior. In addition to the various computational tasks that are scattered throughout Goals 1-3, in this section we propose innovative and integrative approaches that tie together many experimental high-throughput data streams in intuitive and powerful ways.
Metabolic flux analysis and optimization: a successful combination for whole-cell modeling
Metabolic flux analysis methods have proven very successful in performing whole cell studies with explanatory and predictive capacity. As opposed to approaches aimed at modeling dynamic behavior through differential equations and/or stochastic simulations, steady state metabolic flux analyses do not rely on the knowledge of kinetic parameters. Rather, they are based solely on the knowledge of the stoichiometric coefficients of reactions in the metabolic network. One main feature of such models is the possibility of describing mathematically a feasible space representing the set of all metabolic states allowed for an organism under a given set of environmental conditions. Flux Balance Analysis (FBA) (Varma and Palsson 1994; Bonarius, Schmid et al. 1997; Edwards and Palsson 1998) employs optimization methods (Linear Programming) for restricting such feasible space to a single point, hence allowing detailed predictions. FBA has been successfully applied to various microorganisms, such as Haemophilus influenzae (Edwards and Palsson 1999; Schilling and Palsson 2000), Escherichia coli (Edwards and Palsson 2000; Edwards and Palsson 2000; Edwards, Ibarra et al. 2001) and Helicobacter pylori (Edwards, Schilling et al. 2002*), as well as to organelles (Ramakrishna, Edwards et al. 2001). We have recently developed the method of Minimal Perturbation Analysis (MPA) (Segre et al 2002*), a variant of FBA that uses Quadratic Programming for performing accurate predictions of metabolic behavior of mutant strains and of organisms forced to unnatural metabolic or environmental conditions.
Goal 4a: Integrating Metabolic &Regulatory Networks: Applying MPA to Goal 2.
Annotated genome data will be the starting point for characterizing the metabolic network topology in Prochlorococcus, Caulobacter and Pseudomonas. Data will be represented in the form of stoichiometric matrices (Varma and Palsson 1994, Segre et al 2002), which can be directly fed into the FBA and MPA computational framework. Proteogenomic mapping data (Goal 1a) will help implementing a first refinement of the stoichiometric matrices. In parallel, whole genome microarray analysis (Goal 2) will provide information about the possible presence of metabolic pathways not included in the genome annotation. Results from Goal 3 will allow us to determine suitable environmental conditions (nutrient uptake fluxes) for realistic flux analysis calculations.
It will be especially stimulating and interesting to incorporate the photosynthetic process in the metabolic reconstruction of Prochlorococcus. To our knowledge this kind of analysis has never been performed before. We predict that a whole new direction of research in metabolic flux analysis could emerge as a byproduct of this specific part of the project.
Using FBA and MPA analysis, based on this metabolic reconstruction, we will be able to provide experimentally testable predictions of gene knockout effects. Our current FPA/MPA software (Segre et al. 2002* see attached) is especially suitable for performing knockout loops on all genes. For each knockout we will compute both the expected actual metabolic phenotype and the optimal state potentially attainable through adaptation.
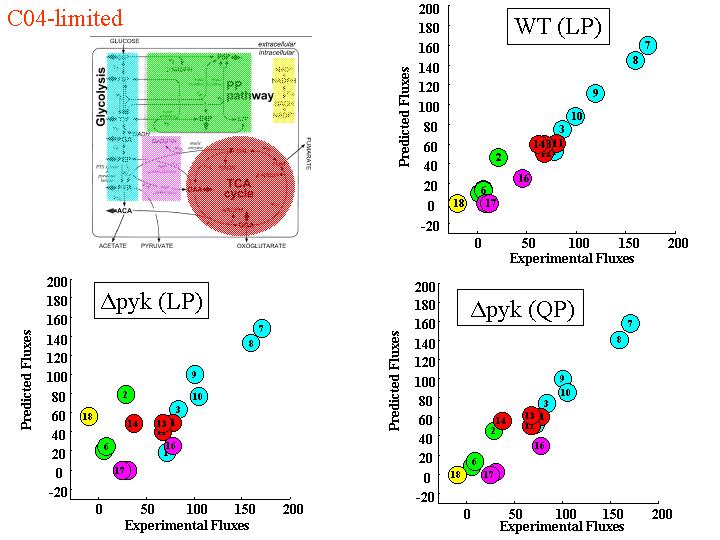
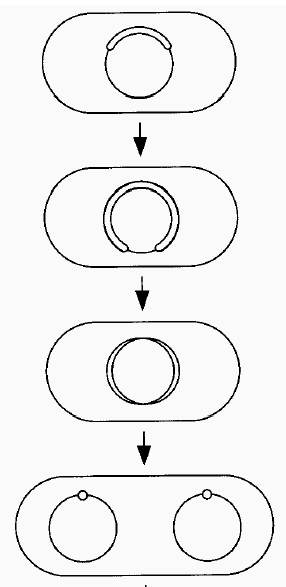
Figure 4a. Comparing FBA & MPA predictions with wild-type and mutant fluxes.
(see Segre et al 2002*)
Regulation-dependent FBA and MPA will be developed for predicting the metabolic responses under different conditions (Covert et al. 2001; Raamsdonk 2001). Environmental stresses will be modeled by tuning the uptake rates of different chemicals. These could include also metals, a feature that has not been implemented in FBA yet. Immediate (suboptimal) response could be calculated using MPA, while the optimal one would ensue from FBA. A comparison of the two predictions would allow one to determine what features of the genetic network should change in order for the optimum to be achieved. We already collaborate with Uwe Sauer's group in Zurich (Emmerling et al. 2002, Segre et al. 2002* see attached) on measuring metabolite fluxes by 13C NMR and stable isotope metabolite tagging for mass spectrometry to test these models and we anticipate extending those experimental studies greatly.
Goal 4b: Addition of metabolic genes with MPA
.Horizontal transfer between different strains (Goal 3a) will be modeled in an FBA/MPA evolutionary model. Addition/deletion of genes, instead of being artificially imposed, could be a consequence of the coexistence of different bacteria in a same ecosystem. A stochastic simulation could determine possible outcome of a competition for survival in such conditions. Alternatively, one could do serially try different gene additions/deletions, and optimize (with FBA/MPA) for metabolic tasks that would correspond to the bioremediation goals.
Goal 4c: Ecosystem Flux Balance Analysis
(in conjunction with the Goal 3b).Another extension of FBA/MPA, the "Ecosystem Flux Balance Analysis", will look at the steady state of a colony of bacteria (or a multiplicity of mixed cells or colonies) in its environment. Communities of different bacteria (possibly dependent on each other), as well as non-biological chemical reactions happening in the environment, will be joined in a single flux model for the global mass balance of a microbial ecosystem. This could be done for a subclass of chemical reactions, so as to make it realistically possible to cope with more complex communities. Alternatively we will use simple communities, e.g. two species with known requirements for cross-feeding fluxes to help experimentally explore whole combined-network systems. Once the stoichiometric models are validated, FBA an MPA can produce accurate predictions of the metabolic behavior of microorganism under different nutrient conditions. We will perform systematic calculations of the predicted optimal (FBA) and suboptimal (MPA) responses for an array of different environmental conditions.
(Goal 4d) Compartmentalized FBA and MPA
(connected with Goal 3c)Compartmentalized FBA and MPA could be performed as extensions of standard flux balance or of "Ecosystem Flux Balance". In the case of communities potentially shifting to a biofilm phase, different nutrient conditions (e.g. different oxygen availability) could be used for simulating transitions between phases, and optimization of multiple-phase growth rates could be performed. The presence of toxins in the different phases could be included here as well.
Goal 4e: Spatiotemporal (4D mechanical/compartmental) model
We intend to integrate genomic knowledge with three dimensional structure to model chromosomal folding and replication in organisms like Prochlorococcus and Caulobacter. Detailed knowledge of the spatial positions of genes in the cell will add resolution to our dynamic models and enhance their predictive accuracy for goals 2 and 3. The method will combine previously unrelated approaches from genomics, 3-D structure, and dynamical systems to allow the first 4-D modeling of a cell throughout its cell cycle.
The structure of simple bacterial chromosomes such as those in Prochlorococcus and Caulobacter will be computationally modeled based on constraints derived from genomics, cellular biology, in vivo crosslinking (Dekker et al. 2001), FISH, and topology. The model will require both computational and experimental efforts - with computational prediction providing hypotheses for experiment and experiment validating and refining computational hypotheses.
Our initial work will focus on how the cell solves the problem of folding circular DNA, which is approximately 100 times the cell diameter (in circumference) into the cell. This chromosomal packing must allow the cell to accomplish its manifold tasks including transcription, metabolism, transport, and replication. These tasks place constraints on the possible conformations of the chromosome.
The most stringent constraints are provided by replication and chromosome segregation. The genome must be copied and the copies must be disentangled and physically separated from each other during division.
Our model for replication is bi-directional with paired forks and a 4-polymerase assembly, which has been suggested several times in the literature. (Dingman CW 1974;Lemon & Grossman 2001; Sundin & Varshavsky 1980; Hearst et al. 1998; Bouligand & Norris 2000; Roos et al. 2001)
This model has the advantage of simply linking replication and segregation since the replication leads to disentangled copies. The bidirectionality introduces a folding constraint of symmetry about the origin of replication (since the polymerases are joined symmetric points must be close together when replicated.) Additional biochemical data has yielded the constraint that the origin and terminus of replication are at opposite poles during most of the cell cycle. (Jensen and Shapiro 1999)
.
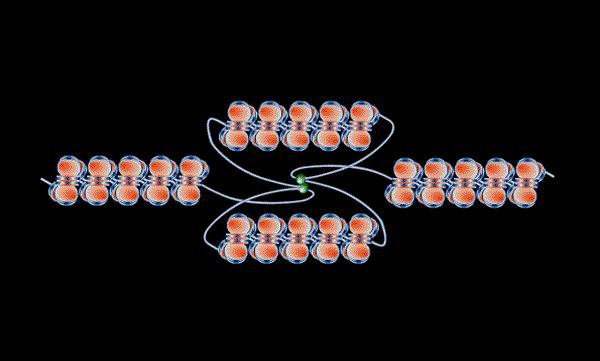
Figure 4b (above), the bi-directional replication of a segment of DNA (left) - linked polymerases, green. The resulting segregation of chromosomes without entanglement (right) (Hearst et al 1998)
Another constraint is suggested by the existence of membrane bound polysomes. The simple bacteria that we are modeling lack sophisticated transport machinery. It is more efficient for the DNA coding for membrane proteins to be close to the membrane where it can be transcribed, translated, and the proteins directly inserted. Since roughly 10% of a genome codes for membrane proteins localizing these points to the surface of the cell significantly reduces the number of possible conformations.
Other (somewhat softer) constraints are provided by protein complexes such as ribosomes, transcription machinery, and carboxysomes (Cannon et al. 2001), which are more energetically efficient to assemble if the genes coding for their components are close to each other in space.
Additionally we can combine information from the stoichiometric matrices used in FBA and MPA to suggest constraints based on the structure of enzyme factories and also add information about the topology of the genetic network in these organisms to provide further constraints. The increasing number of cases with established channeling of substrates among enzymes increases this type of constraint (Bouffard, et al. 1994; Huang, et al. 2001).
In fact, the combination, of all of these constraints should be sufficient to overconstrain the chromosome structure. One can ask statistical questions about the assumed constraints by dropping certain constraints and seeing how well they are met by enforcing others.
The model will be able to suggest experiments. For instance, it will be able to predict sets of points that should be close to each other or close to the membrane but which are not initial constraints. These points can be visualized using arrays of lac operons and GFP lac fusions (Jensen and Shapiro 1999). The analysis of chromosome conformation by intramolecular circularization ligation developed by the Kleckner group at Harvard (Dekker et al. 2002) provides inspiration for a method in which more than one conformational constraint can be obtained per chromosomal molecule. This method is a variant of the polony and crosslinking methods described in Goal 1c. It is crucial to determine if there are multiple conformations available at a particular point in the cell division cycle.
Once an energy metric is defined which will provide a minimum for optimal structures that meet the constraints, these structures can be found using traditional Monte Carlo methods and algorithms known from NMR structure prediction.
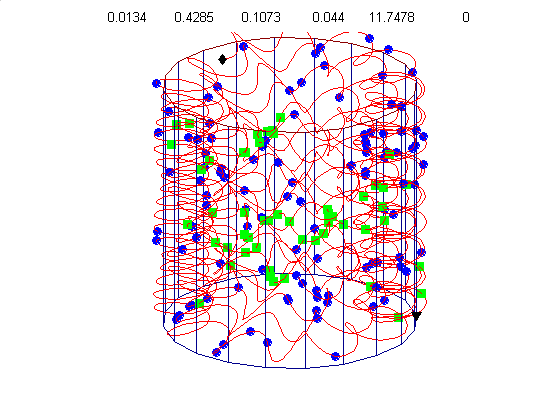
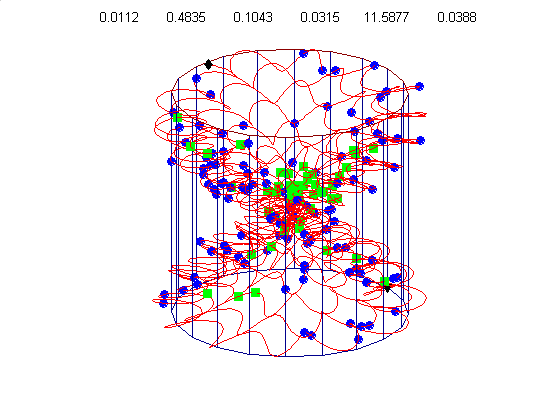
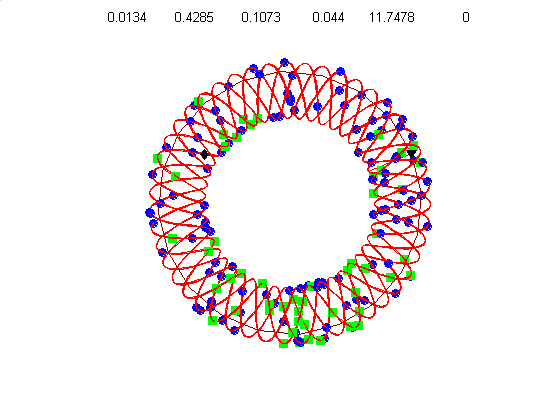
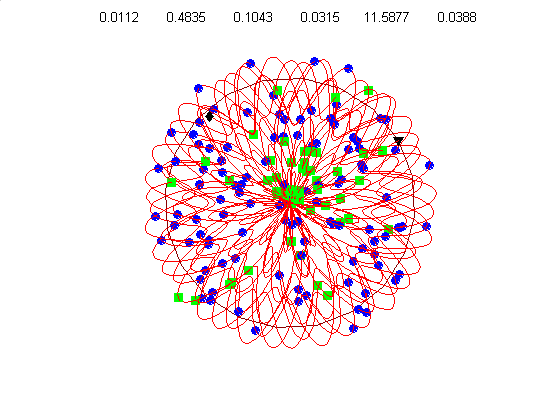
We currently use a metric based on replication symmetry, origin terminus polarity, replication entanglement, membrane constraints, and ribosomal protein complex constraints and have already generated preliminary structures for the small bacterium Mycoplasma pneumoniae.
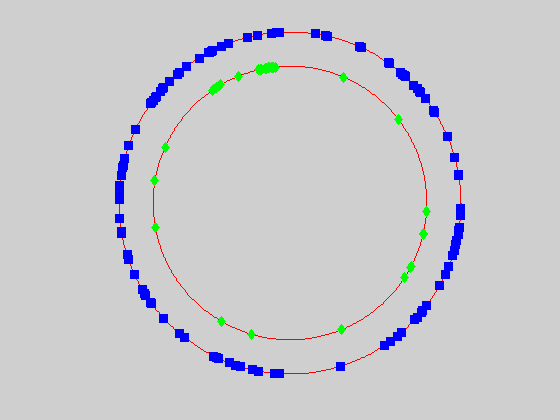
Figure 4c, right: distribution of membrane proteins (blue) and ribosomal proteins (green) along the circular chromosome of Mycoplasma pneumoniae.
.
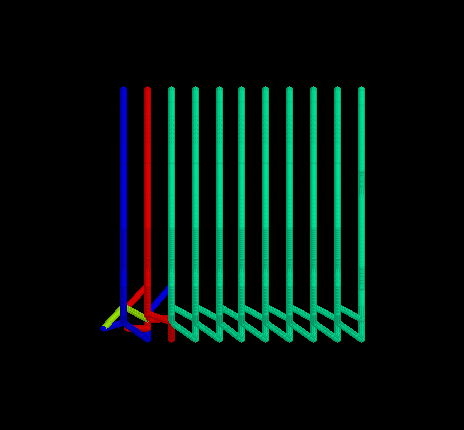
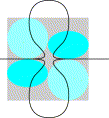
Our algorithm performs random walks in parameter space for a class of supercoiled helices. The parameters include, helical rise, supercoil frequency, large helix amplitude, amplitude of cosine and sine components of the supercoil, and an envelope frequency for the large helix. This allows a wide diversity of structures from simple helices to very complex supercoiled helices. Our energy metric is already able to distinguish between physiologically attractive structures like figure 4d (below) and 4g, relative to less optimal structures like figure 4e & 4f.