John Aach and Wayne Rindone
January 31, 2000
ExpressDB is a relational database for maintaining yeast RNA expression data. It is intended as a demonstration of how such data can be managed, and of the benefits such management confers. As of July, 1999, over 17.5 million pieces of information have been loaded into ExpressDB deriving from 11 source studies. The EXD web query system allows data from multiple source studies to be retrieved to user specifications and collated by ORF name. A manuscript on ExpressDB, the data loaded into it, and how it may be analyzed, has been submitted for publication.
We emphasize that ExpressDB is a demonstration system. It is implemented in Sybase 11.0.3 and runs on a shared DEC 3000 development server running DEC Unix 4.0.D. The performance of the database and the server can easily be overtaxed. Therefore, while you are free to submit complex queries that return large amounts of data, you will be happiest if you limit yourself to simpler queries involving not more than ~10 measures over all or a group of ORFs.Readers of our article "Systematic management and analysis of yeast gene expression data" should be aware that the database and query application have migrated to a new organism-general version of ExpressDB, although for the time being only yeast data sets are publicly available. One consequence of this is that the database is now built upon an entity "Feature" that is more general than "ORF" to support loading of expression information for genetic features other than Open Reading Frames. However, we are still at this time only presenting expression data for yeast, and yeast data collected to date have dealt with ORFs almost exclusively. Therefore, this help document continues to refer to ORFs rather than Features, except where a distinction is important.
We are also slowly developing an integrated database for functional genomics called Biomolecule Interaction Growth and Expression Database (BIGED). BIGED is intended to support and integrate RNA expression data with other kinds of functional genomics data (protein expression, competitive growth, etc.). You are welcome to examine its data model here.
Most RNA expression data is reported in tables with the ORF name as a row header and with each column representing a measurement under a different condition or of a different type. These can easily be maintained as databases with a single table whose record layout corresponds to the fixed row structure. But under this strategy, each different set of experiments with a different selection of measurements and conditions would have to have their own table and there would be as many tables as sets of experiments.
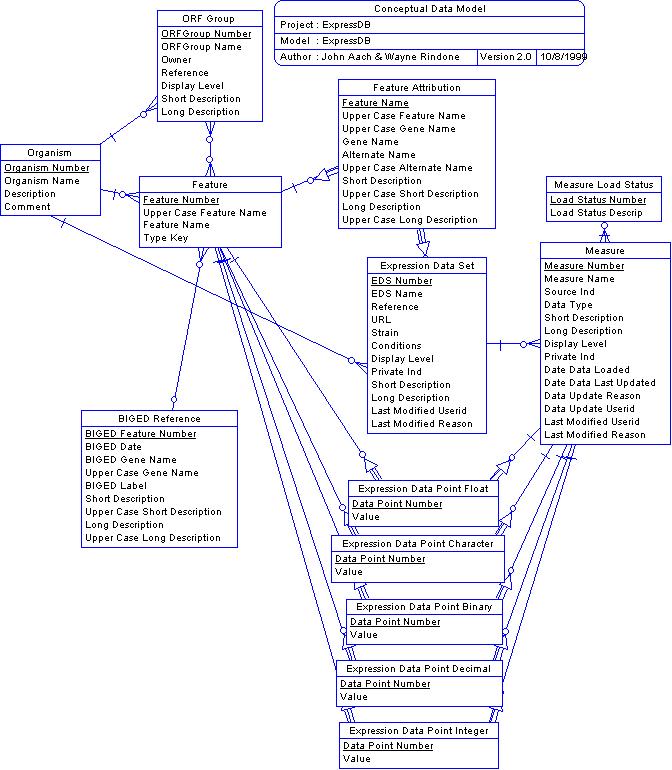
The basic concept behind ExpressDB is to attempt to solve this problem by providing a generalized two-dimensional table structure. Row headings, as above, are Saccharomyces cerevisiae ORFs. But rather than providing a fixed set of column headings, a separate Measure table is used to define measures and measurement types and actual data values are maintained in a third table, Expression Data Point (actually five such tables, see below), maintained in a database relationship with ORF and Measure records. The set of Measures that correspond to the original set of experiments is maintained by an Expression Data Set record. The situation is as depicted here:
The function of the Feature table is to provide a unique reference and internal key for every ORF or other feature referred to by every experimental data set in the database. The internal key is FeatureNo, a unique integer value assigned to every feature. At present features in files loaded into the database are identified with internal Feature table entries by their feature (ORF) names. Data files loaded into the database commonly contain data for experimental controls as well as yeast ORFs. The Feature table contains keys and names for these controls as well as the yeast ORFs that are the targets of the experiment. Feature records are also added as needed to support BIGEDRef and ORFGroup records (see below).
The Measure table gives descriptive information about an experimental measure being stored for each ORF or other feature. Examples of measures include absolute or relative gene expression levels, background measures, quality indicators, and descriptive information. The data values themselves are maintained in Expression Data Point (EDP) tables each record of which is associated with an individual Feature and Measure record. Because data may be in any of several formats, different EDP tables are provided for each of the following data types: binary, character, decimal, float, and integer. The format associated with the Measure is recorded in its Data Type field. Data Type values can be "f" (float), "c", (character), "b" (boolean), "i" (integer), "d" (decimal). Character data must be 255 bytes or less, decimal data must be compatible with a scope and precision of (15,7), and float data is maintained as double precision.
It is not uncommon to find multiple measurement values for an ORF or other feature for a measure in an experiment. This shows up as multiple lines for an ORF in an input source data file, and the ORF is referred to variously as having "multiple rows", "multiple lines", or "multiple data points". This can be the result of multiple spots for an ORF on a cDNA microarray or multiple features for an ORF on an Affymetrix oligonucleotide array. To allow these to be recorded, an auxiliary key Data Point Number is provided in all EDP tables.
Each measure record is owned by an Expression Data Set record. This record documents the source of the measurement data. Experiments whose data are recorded in ExpressDB are usually part of larger sets of related experiments. For instance, ExpressDB contains data from several sets of experiments which collect RNA expression levels at different time points for all ORFs in synchronized cells. Each time point can give rise to many measurements -- expression levels, computed values, data quality indicators, comments, etc. -- each of which is represented by a single Measure record. The entire set of Measure records for all the time points is then linked to a single Expression Data Set. A Reference field in Expression Data Set points back to the original associated article, if there is one, and a URL field to the URL that the data came from. Strain and Conditions fields allow short descriptions of experimental conditions used in the Expression Data Set.
ExpressDB allows us the option of recording our own variants of the data reported by the original experimenters in new Measure records in addition to the original data. This might be done to add computed fields, new normalizations, etc. The indicator Source Ind is used to describe whether the data in a Measure comes directly from the source indicated in the Expression Data Set, or has been added by us. When Source Ind is on it means that the measure comes from the original source.
To assist with the interpretation of yeast expression data, extracts of current Saccharomyces Genome Database (SGD) gene name and description data are maintained in the ExpressDB BIGEDRef table. Those ORFs in the ORF table whose names are recognized by SGD are linked with their corresponding BIGEDRef information through a database relationship that also links to additional SGD information stored in the BIGED database mentioned above. Additionally, researchers commonly report gene names and descriptions along with measurement data, and they occasionally use ORF names that are no longer current. These attributions are maintained in the ExpressDB FeatureAttirbution tables. This provides information that can be used to track down any confusions or inconsistencies in usage of ORF or gene names across the database.
Gene names, Feature (ORF) names, and Feature descriptions are maintained both in the case originally given by the experimenter and also in upper case. Upper case versions are used to satisfy case independent queries. Because feature descriptions can be lengthy, but database "text" data type fields that support > 255 bytes are both space- and performance- inefficient, both 'short' (varying character 255) and 'long' (text) Feature Description field are maintained. The long version is used only when needed.
Other features
Short and long description fields have been provided to store free form text descriptions in many tables. The short description is for easy reference and display but is only 255 bytes in length. The long text description allows unlimited text storage for details that may be optionally provided.
The tables EDS, Measure, and ORFGroup have a field Display Level that is used by the EXD web-interface application to control which subset of these records are displayed. Display Level may take on the values 1 and 2. A 1 means the record is always displayed. It represents a Measure, EDS, or ORFGroup that we believe to be of most interest and will be a relatively common target of selection. A 2 represents a record that we have recorded that is of less interest but may yet be an occasional target of selection. These will not be displayed by default but the user may request to see them. At this time no values other than 1 and 2 are implemented, but the option exists to associate higher values with successive sets of unabridged data.
The tables EDS and Measure also have at attribute Private Ind that describes the degree of privacy and, therefore, protection that is to be accorded the EDS or Measure record. A private EDS or Measure should not be publically accessible. The default for this indicator is 'off'. Private records are not available through the EXD query system.
Each table also contains fields for management data. All tables have the two indicators Is Updated Ind and Is Deleted Ind. All tables but the 5 Expression Data Point tables have the date fields Last Modification Date and Date Entered. The Measure and EDS tables contain two fields Last Modified Userid and Last Modified Reason that may be used to indicate who last updated the contents of these records and why (e.g., changing annotations). Measure contains four fields for capturing management information about the EDP records associated with the Measure: Date Data Loaded describes the data load date, Date Data Last Updated describes the date the data was last modified, for whatever reason. Data Update Userid captures the userid of the person who updated the data, and Data Update Reason the reason for the update. Thus, information on management of the data points is distinguished from information on the Measure record itself.
The Value fields of numeric and character EDP tables (EDPC, EDPD, EDPF, EDPI) allow nulls. Null Value fields are used to record situations where no measurement is provided for an ORF in an experiment; i.e., the source data file field for the ORF measurement is empty or blank. We originally tried the alternative of simply inserting no EDP record for unprovided ORF measurements. However, this lead to a problem in loading procedures whereby some measurements for ORFs with multiple rows could be associated with the wrong row when prior row measurement values were empty, so this alternative was rejected. But nulls add considerably to space requirements for the database, so the issue may eventually be revisited. Null values are not supported by the database software for binary fields, so Value in EDPB can never be null.
As already noted, it is not uncommon for multiple values to be given for a single Measure record and a single ORF or other feature. The provision of a Data Point Number key field in the Expression Data Point tables allows the database to accept such records, but they can yet lead to confusing results, as seen in the following diagram:
In this figure, M1-M4 represent measures in one of the two data sets Data set 1 and Data set 2 as shown. Data Set 1 only has two rows for ORF1 (Data Point 0 and 1), while Data set 2 has 1 row only (Data Point 0). Selection conditions have been specified that involve M1 alone (a), M1 and M2 (b), and M1 and M3 (c). Passage and failure of selection conditions is indicated by ü and ´ respectively. The logical connective for the query is "and". (a) A feature is selected by both a selection condition and its opposite condition - e.g. if M1 is a numeric measure and the selection is that this measure be > 0 in one case and <= 0 in the other. (b) ORF1 is not selected but would be if the DataPoint 0 and 1 values of M2 were interchanged. (c) DataPoint 0 and DataPoint 1 rows fail to satisfy both M1 and M3 selection conditions so ORF1 will not be represented in the query response. However, if the ORF1 rows were loaded in reverse order in Data set 1, a row would be reported for DataPoint 0 that would consist of the current DataPoint 1 values of M1 and M2 from Data set 1 and the DataPoint 0 values of M3 and M4 data from Data set 2.
Ultimately these issues cannot be solved by database design. The problem arises from lack of uniformity of meaning of multiple data points across the experiments which report them. In one experiment, multiple rows may correspond to use of two different cDNA probes for an ORF on a microarray -- P1 and P2. In a second experiment, the order may be reversed to P2 and P1. DataPoint 0 will thus represent P1 in one experiment and P2 in the other. More consistent registration of the data is only possible to the extent that experimenters use the same probes in the same order, or provide enough information that we as database curators can figure it out.
These confusions are unlikely to arise for Measures within an Expression Data Set since common procedures are usually used across all experiments in the set. But they can be a problem when comparing Measures from different Expression Data Sets. Because of this, we believe that consolidation of multiple measurements for an ORF is an important step in normalizing reported data. We have discussed how this may be done in a manuscript that has been submitted for publication.
The volatility of gene and ORF names is a problem for any biological database, since the use of different names by different researchers makes it difficult to properly resolve data across multiple data sets to the same genes. In the case of yeast the situation is in good shape thanks to the sequencing of the genome and ongoing work by curators at SGD to identify ORFs and standardize unique names for them. This made it possible and practical to simply use ORF names to identify yeast gene references across data sets in the first implementation of ExpressDB. However, use of different releases of SGD information by different researchers over time, as well as differences between Affymetrix GeneChip and SGD identifiers, has still led to use of discrepant ORF names in reported data. A recent exercise in normalizing data from 9 source files in ExpressDB found 94 ORFs that could not be matched up across data sets or with ORFs currently recognized by SGD. As the problem will likely increase over time as SGD curation continues, and must in any case be generally addressed to extend ExpressDB to other organisms, we have improved our design with changes that address both issues together. Support for multiple organisms has been accomplished by an Organism table that relates Feature and ORF Group records to their associated Organism record, and we have replaced the yeast-specific SGD Info table with the BIGEDRef table, which provides a more generalized structure for identifying external biological databases and Feature references to them in the form of information extracted from and pointers to information maintained in the BIGED database described above.
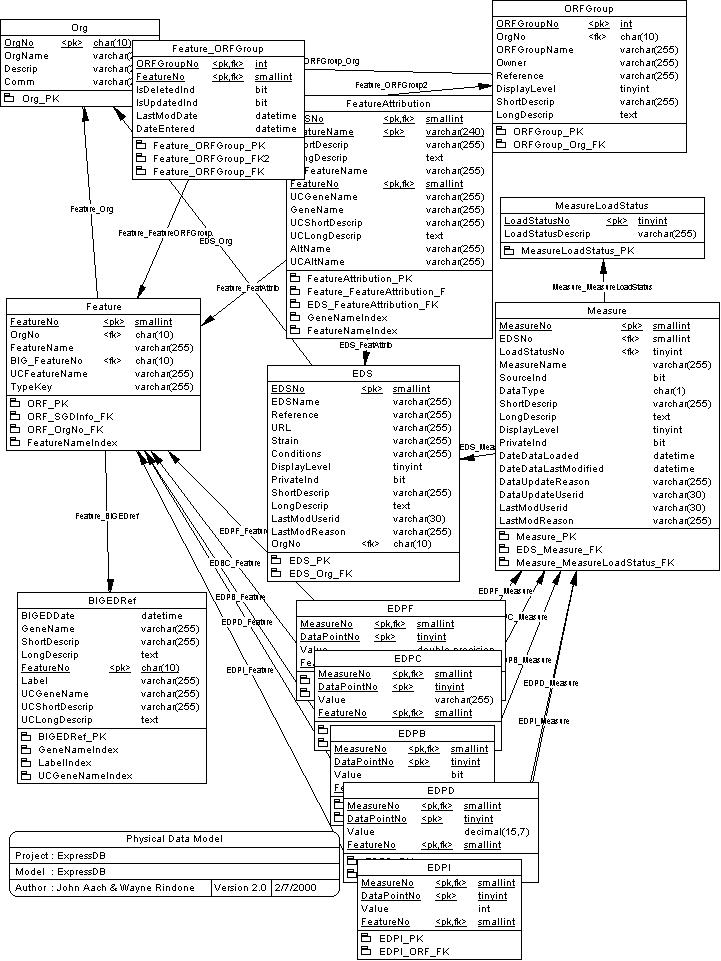
create table BIGEDRef
(
FeatureNo char(10) not null,
BIGEDDate datetime not null,
Label varchar(255) null ,
GeneName varchar(255) null ,
UCGeneName varchar(255) null ,
ShortDescrip varchar(255) null ,
UCShortDescrip varchar(255) null ,
LongDescrip text null ,
UCLongDescrip text null ,
DateEntered datetime not null ,
LastModDate datetime not null ,
IsDeletedInd bit not null,
IsUpdatedInd bit not null,
constraint PK_BIGEDREF primary key (FeatureNo)
)
on tables
go
create table EDPB
(
MeasureNo smallint not null,
FeatureNo smallint not null,
DataPointNo tinyint not null,
Value bit not null,
IsDeletedInd bit not null,
IsUpdatedInd bit not null,
constraint PK_EDPB primary key (MeasureNo, DataPointNo, FeatureNo)
)
on tables
go
create table EDPC
(
MeasureNo smallint not null,
FeatureNo smallint not null,
DataPointNo tinyint not null,
Value varchar(255) null ,
IsDeletedInd bit not null,
IsUpdatedInd bit not null,
constraint PK_EDPC primary key (MeasureNo, DataPointNo, FeatureNo)
)
on tables
go
create table EDPD
(
MeasureNo smallint not null,
FeatureNo smallint not null,
DataPointNo tinyint not null,
Value decimal(15,7) null ,
IsDeletedInd bit not null,
IsUpdatedInd bit not null,
constraint PK_EDPD primary key (MeasureNo, DataPointNo, FeatureNo)
)
on tables
go
create table EDPF
(
MeasureNo smallint not null,
FeatureNo smallint not null,
DataPointNo tinyint not null,
Value double precision null ,
IsDeletedInd bit not null,
IsUpdatedInd bit not null,
constraint PK_EDPF primary key (MeasureNo, DataPointNo, FeatureNo)
)
on tables
go
create table EDPI
(
MeasureNo smallint not null,
FeatureNo smallint not null,
DataPointNo tinyint not null,
Value int null ,
IsDeletedInd bit not null,
IsUpdatedInd bit not null,
constraint PK_EDPI primary key (MeasureNo, DataPointNo, FeatureNo)
)
on tables
go
create table EDS
(
EDSNo smallint not null,
EDSName varchar(255) not null,
Reference varchar(255) null ,
URL varchar(255) null ,
Strain varchar(255) null ,
Conditions varchar(255) null ,
DisplayLevel tinyint not null,
PrivateInd bit default 0 not null,
ShortDescrip varchar(255) null ,
LongDescrip text null ,
LastModUserid varchar(30) null ,
LastModReason varchar(255) null ,
DateEntered datetime not null ,
LastModDate datetime not null ,
IsDeletedInd bit not null,
IsUpdatedInd bit not null,
constraint PK_EDS primary key (EDSNo)
)
on tables
go
create table Feature
(
FeatureNo smallint not null,
OrgNo char(10) not null,
FeatureName varchar(255) not null,
DateEntered datetime not null ,
LastModDate datetime not null ,
IsDeletedInd bit not null,
IsUpdatedInd bit not null,
BIG_FeatureNo char(10) null,
UCFeatureName varchar(255) null,
TypeKey varchar(255) null,
c
onstraint PK_FEATIRE primary key (FeatureNo)
)
on tables
go
create table Feature_ORFGroup
(
FeatureNo smallint not null,
ORFGroupNo int not null,
LastModDate datetime not null ,
DateEntered datetime not null ,
IsDeletedInd bit not null,
IsUpdatedInd bit not null,
constraint PK_FEATURE_ORFGROUP primary key (ORFGroupNo, FeatureNo)
)
on tables
go
create table FeatureAttribution
(
EDSNo smallint not null,
FeatureNo smallint not null,
FeatureName varchar(255) null ,
UCFeatureName varchar(255) null ,
GeneName varchar(255) null ,
UCGeneName varchar(255) null ,
AltName varchar(255) null ,
UCAltName varchar(255) null ,
ShortDescrip varchar(255) null ,
UCShortDescrip varchar(255) null ,
LongDescrip varchar(255) null ,
UCLongDescrip varchar(255) null ,
DateEntered datetime not null ,
LastModDate datetime not null ,
IsDeletedInd bit not null,
IsUpdatedInd bit not null,
constraint PK_FEATUREATTRIBUTION primary key (EDSNo, FeatureName, FeatureNo)
)
on tables
go
create table Measure
(
MeasureNo smallint not null,
LoadStatusNo tinyint not null,
EDSNo smallint not null,
MeasureName varchar(255) null ,
SourceInd bit not null,
DataType char(1) not null,
DisplayLevel tinyint not null,
PrivateInd bit default 0 not null,
ShortDescrip varchar(255) null ,
LongDescrip text null ,
DateDataLoaded datetime null ,
DateDataLastModified datetime null ,
DataUpdateReason varchar(255) null ,
DataUpdateUserid varchar(30) null ,
LastModUserid varchar(30) null ,
LastModReason varchar(255) null ,
DateEntered datetime null ,
LastModDate datetime null ,
IsDeletedInd bit not null,
IsUpdatedInd bit not null,
constraint PK_MEASURE primary key (MeasureNo)
)
on tables
go
create table MeasureLoadStatus
(
LoadStatusNo tinyint not null,
LoadStatusDescrip varchar(255) null ,
DateEntered datetime not null ,
LastModDate datetime not null ,
IsDeletedInd bit not null,
IsUpdatedInd bit not null,
constraint PK_MEASURELOADSTATUS primary key (LoadStatusNo)
)
on tables
go
create table Org
(
OrgNo char(10) not null,
OrgName varchar(255) null,
Descrip varchar(255) null ,
Descrip_ovflw text null ,
Comm varchar(255) null ,
Comm_ovflw text null ,
DateEntered datetime not null ,
LastModDate datetime not null ,
IsDeletedInd bit not null,
IsUpdatedInd bit not null,
constraint PK_ORG primary key (OrgNo)
)
on tables
go
create table ORFGroup
(
ORFGroupNo int not null,
OrgNo char(10) not null,
ORFGroupName varchar(255) not null,
Owner varchar(255) not null,
Reference varchar(255) not null,
DisplayLevel tinyint not null,
ShortDescrip varchar(255) null ,
LongDescrip text null ,
DateEntered datetime not null ,
LastModDate datetime not null ,
IsDeletedInd bit not null,
IsUpdatedInd bit not null,
constraint PK_ORFGROUP primary key (ORFGroupNo)
)
on tables
go
EDBUpdate loads a two-dimensional tab-delimited file (known as a "load file") of ORFs (and/or other features) and measurements into ExpressDB. The load file must have a column containing a feature name and a title line that gives unique headings for every column where the headings correspond to measurements. Features and columns can be provided in any order and there is no requirement that all ORFs must be provided, nor that all measures must be given for a provided feature; however, missing measures must be represented by null fields to preserve column alignment. Moreover, only selected columns need be loaded and a complete file can be loaded in multiple passes.
Loading a data set must be preceded by the creation of an Expression Data Set record describing the data set as a whole and of Measure records corresponding to the data columns to be loaded. EDBUpdate is provided the information for this in a separate "control file" that contains the appropriate descriptions and also associates Measure records with column headings in the load file. The control file also identifies which columns correspond to feature names, gene names, and feature descriptions.
Minor editing of published and locally generated expression data sets is usually required before loading, mostly to satisfy the EDBUpdate load file format requirements. Typical examples are: removal of extraneous free-form descriptive information from provided data files (this can go into Expression Data Set or Measure records), consolidation of multiple column heading lines into single lines, splitting of single provided data file columns into multiple columns where they contain more than one kind of information (e.g., Affymetrix-generated files typically give gene name information in the same column as the ORF name, separating the two by a "/"). Another kind of editing, aimed at improving queriability of the database, is to fill in missing values for measures where these have a clear meaning - e.g., explicitly filling in zero values for null values for a data file that designates zero values that way. This ensures that, for instance, a query for all features for which the corresponding measurement value is < 2 will find those features with zero values; in Sybase, a feature for which this value was stored as null would not pass this criterion. A third kind of editing is the conversion of some data types in load files to simpler ones, e.g., where text is used to convey a binary measurement, it may be converted to actual binary values. A fourth kind is to combine separate load files into a single one where it is clear that rows and row order correspond and EDS-level context information matches.
In some cases more extensive work is required. For instance, SAGE-based expression data is indexed by SAGE tag, not ORF, and SAGE tags have to be identified with ORFs by sequence analysis for the data to be put into a form compatible with ExpressDB's indexing by ORF name. However, SAGE tags cannot always be mapped to unique ORFs. This problem has been solved by registering both minimum and maximum abundances for each ORF, where minimum abundances included only the abundances of those tags uniquely assignable to the ORF and maximum abundances included in addition those shared with other ORFs. In this way the content of SAGE data can be faithfully represented within ExpressDB insofar as it can be associated with ORFs.
A web-based query interface for ExpressDB has been provided through the EXD system. The system can be accessed here. A JavaScript 2.1-supporting web browser such as Microsoft Internet Explorer 4.0+ or Netscape Navigator 4.0+ is required.
Please note the important performance caveat for this demonstration system.
The logical flow through the EXD system is as follows:
The main line of this flow is that the user is solicited for information regarding a query in three steps: The user is first asked to select Expression Data Sets of interest, then to select Measures within these Expression Data Sets, and finally to specify detailed selection criteria. Only Measures within Expression Data Sets selected in the first step are presented in the second, and query specifics for only those Measures selected in the second are presented in the third. Information items such as SGD information as well as gene names and feature descriptions, and the feature names used in the load file, even when they differ from those in current use, may also be selected in the second step, and selection conditions related to them may be specified in the third.
Three forms are presented in the course of this main line of logic and are described in more detail.
The entrance to the EXD query system, this form presents the Expression Data Sets that may be selected by the user. The user checks off one or more of these data sets and clicks the Submit button to get to the Measure Selection Form. Alternatively, clicking on an Expression Data Set hotlink brings the user to a page that displays information about the data set and the experimental conditions it covers.
Expression Data Sets are displayed in alphabetical order by name. However, this ordering is case sensitive, so capitalized names appear first.
This form displays individual Measures and Information Items that the user may select for subsequent display or specification of query conditions. Information Items include SGD Gene Names, SGDIDs, and SGD Feature Descriptions, and any Gene Names and Feature Descriptions associated with Expression Data Sets selected on the preceding Expression Data Set Selection Form. Measures that can be selected include only those associated with previously selected Expression Data Sets. The user checks off one or more Information Items and Measures, and clicks the Submit button to get to the Query Specification form. Alternatively, clicking on a Measure hotlink brings the user to a page that displays information about the Measure.
Because there may be a great many Measures to select from in one or more Expression Data Sets, the Measure Selection Form offers the option of switching between "abridged" and "unabridged" display modes. The "abridged" mode displays the subset of Measures we believe to be of most general interest while the "unabridged" mode displays all. Check marks will be preserved as best they can when switching between display modes, but if you select a Measure that only appears in the "unabridged" mode and then switch to "abridged" mode, it will be lost.
Measures are displayed in alphabetical order by name. However, this ordering is case sensitive, so capitalized names appear first.
The purpose of this form is to solicit query conditions from the user. It is divided into several sections some of which are always present and some of which are present only when certain Measures or information items were previously selected on the Measure Selection Form.
Query processing itself is performed in a sequence of five phases. First, selection conditions on non-Measure related items are processed such as Feature name, ORF Group, and SGD or Expression Data Set gene names and Feature descriptions. Second, statistical selection conditions for numeric measures are resolved to simple numeric thresholds by dynamic calculation of percentile values, or means and standard deviations. Third, measure selections as a whole are processed and integrated with non-measure based selections from the first phase. Processing of these phases involves creation and integration of several temporary tables on the database and ends with a complete list of Feature and Data Point numbers to be reported. In the fourth phase, the actual measure values to be reported corresponding to these ORFs are retrieved from the database and assembled into a file, and user-selected information items such as gene names and Feature descriptions are integrated into this file. The fifth phase involves final small scale editing of the file prior to its presentation to the user. This five phase structure has been designed to avoid built-in database limitations on the complexity of queries and handling of data types that could be exceeded in the course of processing potentially large numbers of selected measurements, information items, and selection conditions. Examples of such limitations are Sybase requirements that the number of tables specified in a query not exceed 16, and Sybase performance considerations concerning the handling of large text fields.
Please contact John Aach with any questions, comments, or problems with ExpressDB and its application environment.
Copyright (c) 1999-2000 by John Aach and Wayne Rindone and the President and Fellows of Harvard University