
| Candidate UniGene cluster: | UniGene Cluster Hs.113916 |
| Description: | Burkitt lymphoma receptor 1, GTP-binding protein |
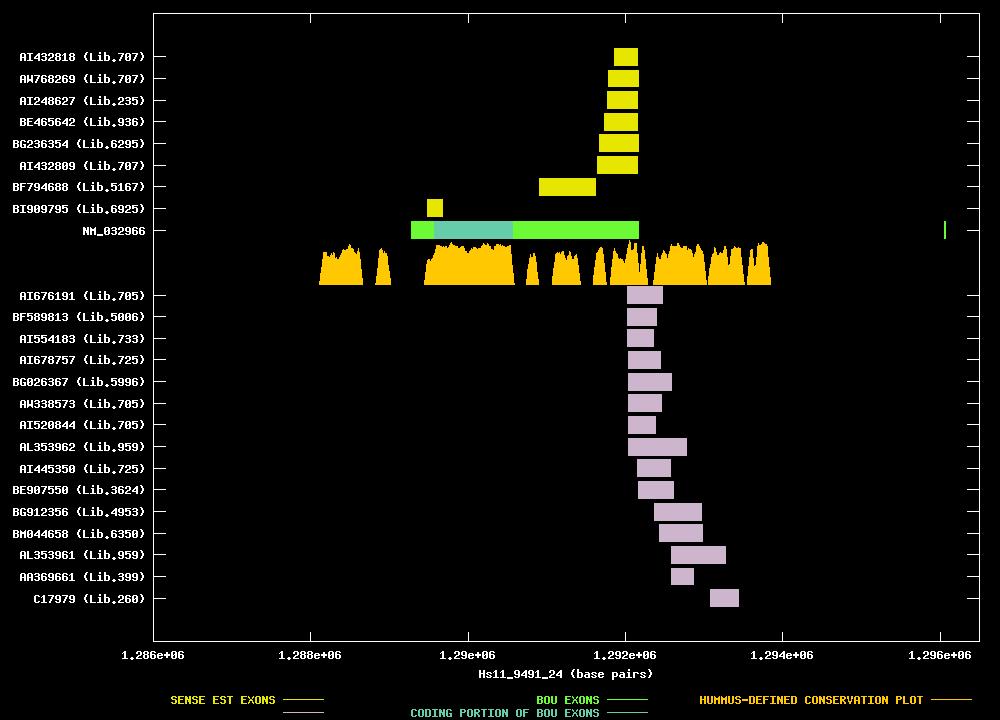
| Best-Of-UniGene (BOU) Sequence | NM_032966 |
| Genomic Coordiantes Displayed: | Bases 1286000 to 1296500 of contig Hs11_9491_24 |
| BOU Orientation Along Contig: | LEFT-TO-RIGHT with respect to contig |
| Link to JPEG of genomic mapping | Hs.113916.jpeg |
| Best sense EST/protein match: | NM_032966 matched ref|NP_001707.1| (NM_001716) Burkitt lymphoma receptor 1, isoform 1; Burkitt lymphoma (E = 0.0) |
| Best antisense EST/protein match: | No protein match with an e-value of less than 1e-10 |
ANTISENSE ESTs
| AI676191 | cDNA clone IMAGE:2324141 | pancreas | 3' read | | ||
| BF589813 | cDNA clone IMAGE:3394188 | sciatic nerve | 3' read | | ||
| AI554183 | cDNA clone IMAGE:2208844 | uterus | 3' read | 1.1 kb | | |
| AI678757 | cDNA clone IMAGE:2256329 | stomach | 3' read | 1.2 kb | | |
| BG026367 | cDNA clone IMAGE:4386537 | osteosarcoma, cell line | 5' read | |||
| AW338573 | cDNA clone IMAGE:2834373 | pancreas | 3' read | | ||
| AI520844 | cDNA clone IMAGE:2129876 | pancreas | 3' read | 1.5 kb | ||
| AL353962 | cDNA clone DKFZp761M218 | amygdala | 3' read | |||
| AI445350 | cDNA clone IMAGE:2141956 | stomach | 3' read | 1.4 kb | ||
| BE907550 | cDNA clone IMAGE:3899407 | epithelioid carcinoma | 5' read | |||
| BG912356 | cDNA clone IMAGE:4940477 | anaplastic oligodendroglioma with 1p/19q loss | 5' read | |||
| BM044658 | cDNA clone IMAGE:5448063 | carcinoma, cell line | 5' read | |||
| AL353961 | cDNA clone DKFZp761M218 | amygdala | 5' read | |||
| AA369661 | cDNA clone ATCC:174258 | placenta | 5' read | |||
| C17979 | cDNA clone GEN555F10 | placenta | 5' read |
| BI909795 | cDNA clone IMAGE:5219901 | leukocyte | 5' read |  | ||
| BF794688 | cDNA clone IMAGE:4339270 | lymphoma, cell line | 5' read | |||
| AI432809 | cDNA clone IMAGE:2121180 | lymph | 3' read | 3.9 kb | | |
| BG236354 | cDNA clone IMAGE:4142380 | lymphocyte | 3' read | |