
| Candidate UniGene cluster: | UniGene Cluster Hs.12082 |
| Description: | TIGA1 |
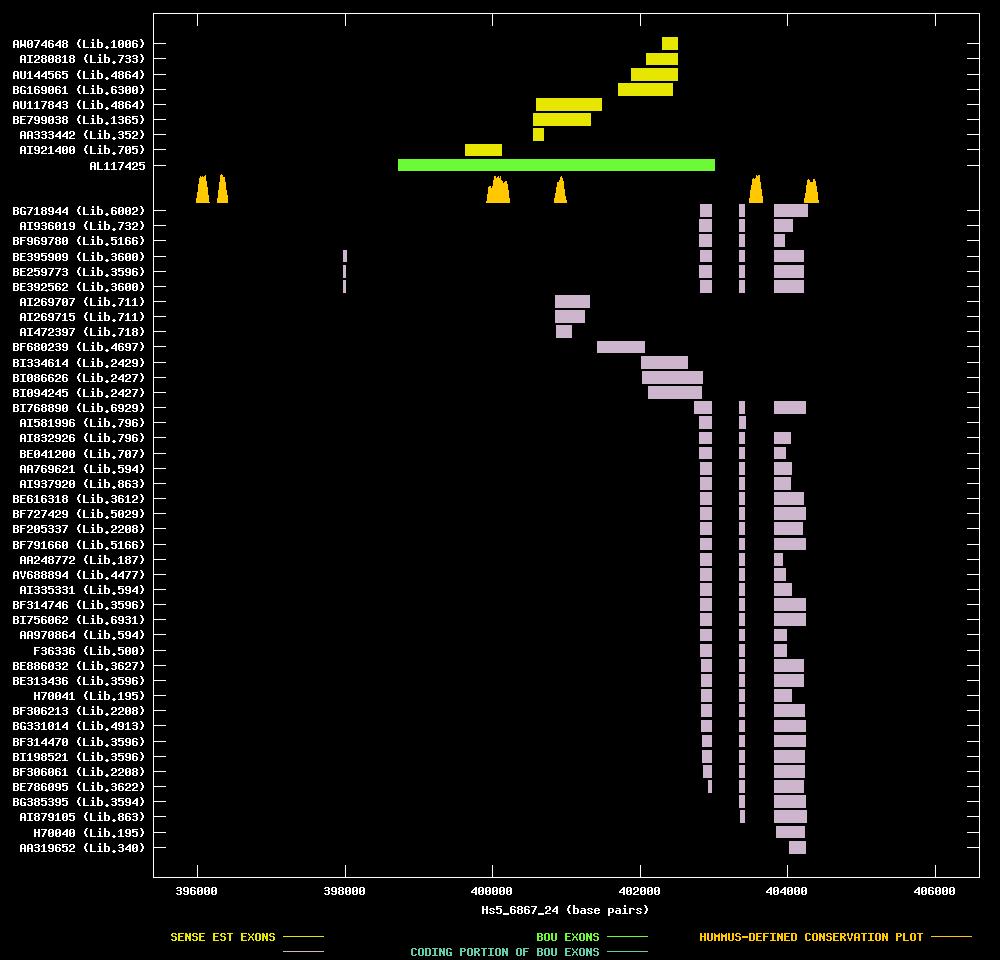
| Best-Of-UniGene (BOU) Sequence | AL117425 |
| Genomic Coordiantes Displayed: | Bases 395400 to 406600 of contig Hs5_6867_24 |
| BOU Orientation Along Contig: | LEFT-TO-RIGHT with respect to contig |
| Link to JPEG of genomic mapping | Hs.12082.jpeg |
| Best sense EST/protein match: | No protein match with an e-value of less than 1e-10 |
| Best antisense EST/protein match: | BG718944 matched ref|NP_443726.1| (NM_053000) TIGA1 [Homo sapiens] (E = 1e-47) |
ANTISENSE ESTs
| BG718944 | cDNA clone IMAGE:4831353 | testis, cell line | 5' read | |||
| AI936019 | cDNA clone IMAGE:2452089 | uterus | 3' read | 0.8 kb | | |
| BF969780 | cDNA clone IMAGE:4360539 | adrenal cortex carcinoma, cell line | 5' read | | ||
| BE395909 | cDNA clone IMAGE:3659970 | endometrium, adenocarcinoma cell line | 5' read | |||
| BE259773 | cDNA clone IMAGE:3508639 | neuroblastoma | 5' read | |||
| BE392562 | cDNA clone IMAGE:3659969 | endometrium, adenocarcinoma cell line | 5' read | |||
| AI269707 | cDNA clone IMAGE:1998294 | brain | 3' read | | ||
| AI269715 | cDNA clone IMAGE:1998295 | brain | 3' read | | ||
| AI472397 | cDNA clone IMAGE:2152937 | colon | 3' read | 2.1 kb | ||
| BF680239 | cDNA clone IMAGE:4296071 | prostate | 5' read | |||
| BI334614 | cDNA clone IMAGE:5141892 | choriocarcinoma | 5' read | |||
| BI086626 | cDNA clone IMAGE:4991815 | placenta | 5' read | |||
| BI094245 | cDNA clone IMAGE:5001127 | placenta | 5' read |