
| Candidate UniGene cluster: | UniGene Cluster Hs.171495 |
| Description: | retinoic acid receptor, beta |
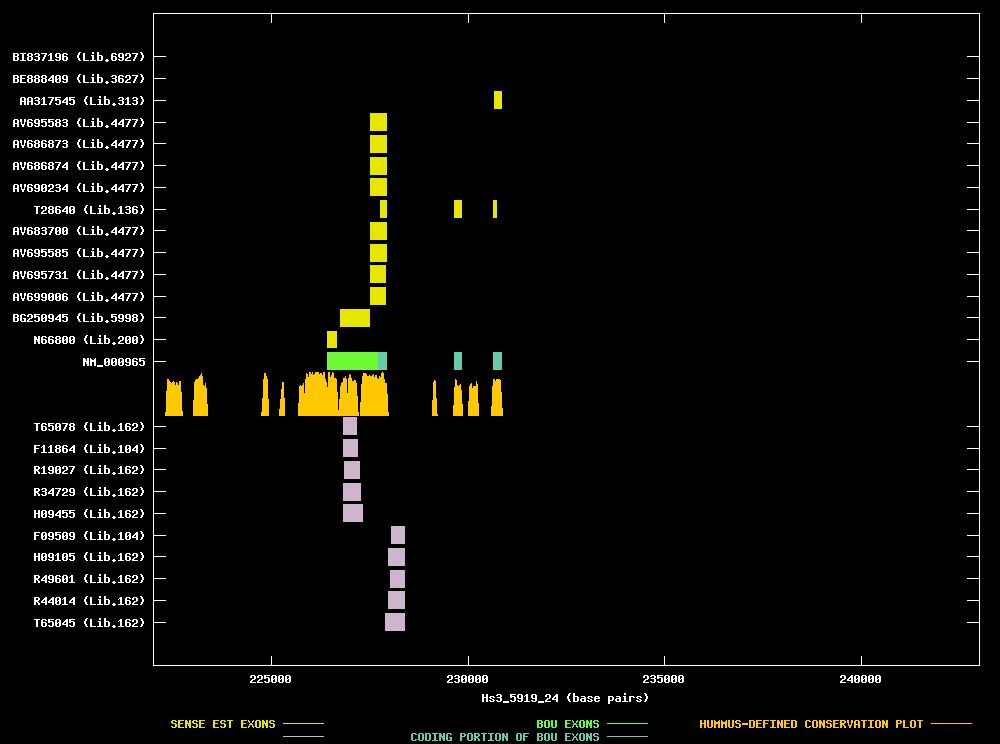
| Best-Of-UniGene (BOU) Sequence | NM_000965 |
| Genomic Coordiantes Displayed: | Bases 222000 to 243000 of contig Hs3_5919_24 |
| BOU Orientation Along Contig: | RIGHT-TO-LEFT with respect to contig |
| Link to JPEG of genomic mapping | Hs.171495.jpeg |
| Best sense EST/protein match: | NM_000965 matched ref|NP_000956.2| (NM_000965) retinoic acid receptor, beta isoform 1; retinoic acid (E = 0.0) |
| Best antisense EST/protein match: | No protein match with an e-value of less than 1e-10 |
ANTISENSE ESTs
| T65078 | cDNA clone IMAGE:21587 | brain | 5' read | 1.2 kb | ||
| F11864 | cDNA clone c32f02 | brain | ||||
| R19027 | cDNA clone IMAGE:32941 | brain | 5' read | 1.0 kb | ||
| R34729 | cDNA clone IMAGE:37413 | brain | 5' read | 1.2 kb | ||
| H09455 | cDNA clone IMAGE:46180 | brain | 5' read | 1.2 kb | ||
| F09509 | cDNA clone c32f02 | brain | 3' read | | ||
| H09105 | cDNA clone IMAGE:46180 | brain | 3' read | 1.2 kb | | |
| R49601 | cDNA clone IMAGE:37413 | brain | 3' read | 1.2 kb | | |
| R44014 | cDNA clone IMAGE:32941 | brain | 3' read | 1.0 kb | | |
| T65045 | cDNA clone IMAGE:21587 | brain | 3' read | 1.2 kb | |
| N66800 | cDNA clone IMAGE:287077 | ear | 3' read | | ||
| BG250945 | cDNA clone IMAGE:4471412 | adenocarcinoma, cell line | 5' read | |||
| AV699006 | cDNA clone GKCFOE09 | hepatocellular carcinoma | 5' read |  | ||
| AV695731 | cDNA clone GKCFOB08 | hepatocellular carcinoma | 5' read | | ||
| AV695585 | cDNA clone GKCFRE03 | hepatocellular carcinoma | 5' read | | ||
| AV683700 | cDNA clone GKCFPB01 | hepatocellular carcinoma | 5' read | | ||
| T28640 | cDNA clone ATCC:103088 | gall bladder | 5' read | | ||
| AV690234 | cDNA clone GKCFQD03 | hepatocellular carcinoma | 5' read | | ||
| AV686874 | cDNA clone GKCFQA06 | hepatocellular carcinoma | 5' read | | ||
| AV686873 | cDNA clone GKCFQA05 | hepatocellular carcinoma | 5' read | | ||
| AV695583 | cDNA clone GKCFRE01 | hepatocellular carcinoma | 5' read | | ||
| AA317545 | cDNA clone ATCC:118055 | eye | 5' read | | ||
| BE888409 | cDNA clone IMAGE:3915516 | leiomyosarcoma | 5' read | | ||
| BI837196 | cDNA clone IMAGE:5229160 | pooled pancreas and spleen | 5' read | |