| Candidate UniGene cluster: | UniGene Cluster Hs.182698 |
| Description: | mitochondrial ribosomal protein L20 |
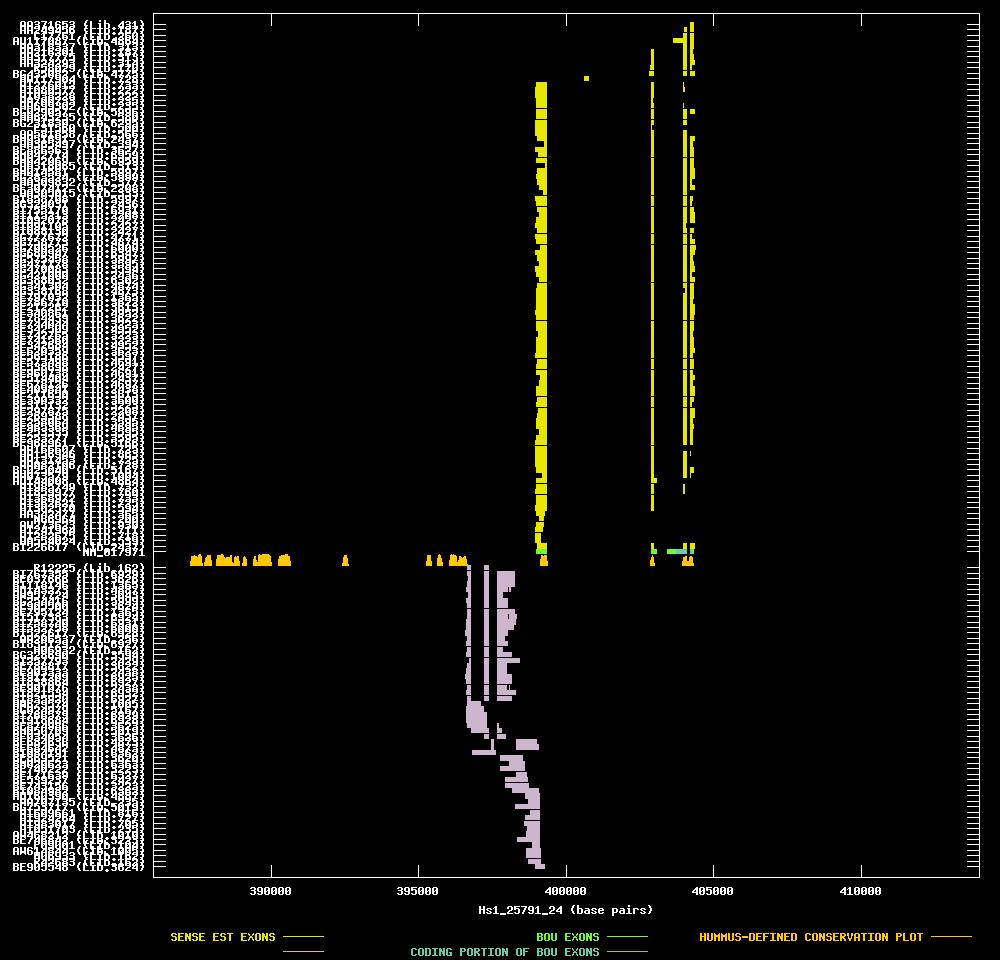
| Best-Of-UniGene (BOU) Sequence | NM_017971 |
| Genomic Coordiantes Displayed: | Bases 386000 to 414000 of contig Hs1_25791_24 |
| BOU Orientation Along Contig: | RIGHT-TO-LEFT with respect to contig |
| Link to JPEG of genomic mapping | Hs.182698.jpeg |
| Best sense EST/protein match: | BE514404 matched dbj|BAB40849.1| (AB049644) mitochondrial ribosomal protein L20 (L20mt) [Homo (E = 2e-81) |
| Best antisense EST/protein match: | No protein match with an e-value of less than 1e-10 |
ANTISENSE ESTs
| R12225 | cDNA clone IMAGE:26011 | brain | 5' read | 1.9 kb | ||
| BI767355 | cDNA clone IMAGE:5206943 | pooled lung and spleen | 5' read | |||
| BF037666 | cDNA clone IMAGE:3865346 | adenocarcinoma | 5' read | |||
| BI118146 | cDNA clone IMAGE:5015766 | small cell carcinoma | 5' read | |||
| AU143273 | cDNA clone Y79AA1001665 | 5' read | ||||
| AW957724 | cDNA clone (no-name) | |||||
| BG254416 | cDNA clone IMAGE:4477107 | adenocarcinoma, cell line | 5' read | |||
| BE905500 | cDNA clone IMAGE:3897389 | epithelioid carcinoma | 5' read | |||
| BE795124 | cDNA clone IMAGE:3946646 | small cell carcinoma | 5' read | |||
| BI517383 | cDNA clone IMAGE:5162865 | pooled colon, kidney, stomach | 5' read | |||
| BI758740 | cDNA clone IMAGE:5200350 | brain | 5' read | |||
| BI552758 | cDNA clone IMAGE:5264910 | hippocampus, cell line | 5' read | |||
| BI522617 | cDNA clone IMAGE:5239952 | brain | 5' read | |||
| AA206537 | cDNA clone IMAGE:645819 | 5' read | ||||
| BI835129 | cDNA clone IMAGE:5227704 | pooled pancreas and spleen | 5' read | |||
| H06932 | cDNA clone IMAGE:44541 | brain | 5' read | 1.9 kb | ||
| BG328690 | cDNA clone IMAGE:4547511 | adenocarcinoma cell line | 5' read | |||
| BI257793 | cDNA clone IMAGE:5109283 | choriocarcinoma | 5' read | |||
| BE788817 | cDNA clone IMAGE:3878408 | large cell carcinoma | 5' read | |||
| BE903333 | cDNA clone IMAGE:3957148 | choriocarcinoma | 5' read | |||
| BI911209 | cDNA clone IMAGE:5212237 | leukocyte | 5' read | |||
| BI838864 | cDNA clone IMAGE:5221631 | pooled pancreas and spleen | 5' read |