
| Candidate UniGene cluster: | UniGene Cluster Hs.184846 |
| Description: | Homo sapiens, Similar to zinc finger protein 304, clone MGC:4079 IMAGE:3530863, mRNA, complete cds |
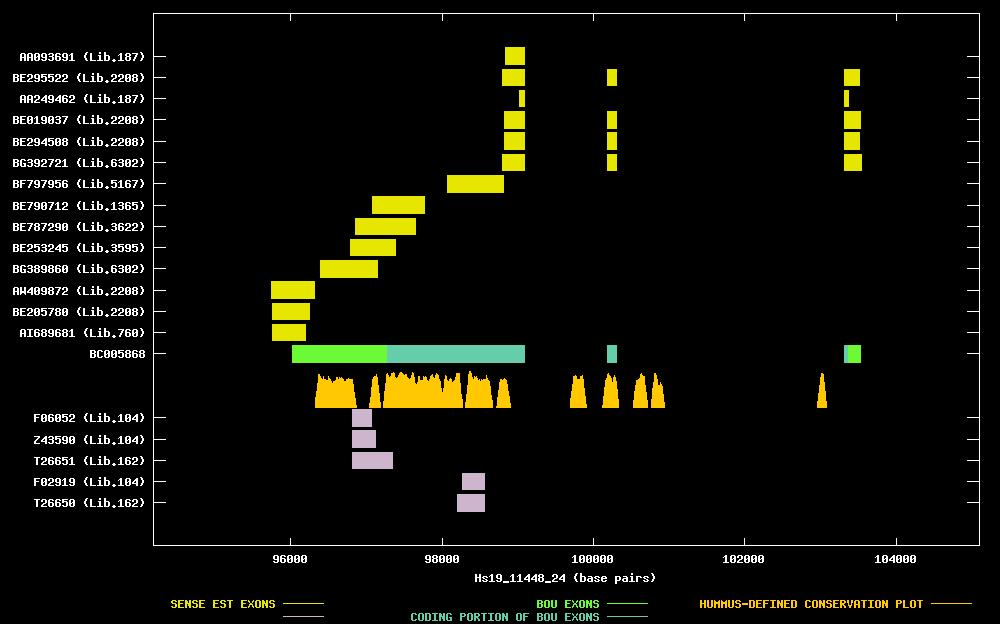
| Best-Of-UniGene (BOU) Sequence | BC005868 |
| Genomic Coordiantes Displayed: | Bases 94188 to 105101 of contig Hs19_11448_24 |
| BOU Orientation Along Contig: | RIGHT-TO-LEFT with respect to contig |
| Link to JPEG of genomic mapping | Hs.184846.jpeg |
| Best sense EST/protein match: | BC005868 matched ref|XP_030206.1| (XM_030206) hypothetical protein XP_030206 [Homo sapiens] (E = 0.0) |
| Best antisense EST/protein match: | No protein match with an e-value of less than 1e-10 |
ANTISENSE ESTs
| F06052 | cDNA clone c0vd03 | brain | ||||
| Z43590 | cDNA clone c1fg09 | brain | ||||
| T26651 | cDNA clone LLAB51G9 | brain | 5' read | |||
| F02919 | cDNA clone c1fg09 | brain | 3' read | | ||
| T26650 | cDNA clone LLAB51G9 | brain | 3' read | |
| AI689681 | cDNA clone IMAGE:2269090 | uterus | 3' read | 3.2 kb | ||
| BE205780 | cDNA clone IMAGE:3009681 | rhabdomyosarcoma | 3' read | |||
| AW409872 | cDNA clone IMAGE:2961247 | rhabdomyosarcoma | 3' read | |||
| BG389860 | cDNA clone IMAGE:4523634 | embryonal carcinoma, cell line | 5' read | |||
| BE253245 | cDNA clone IMAGE:3357543 | retinoblastoma | 5' read | |||
| BE787290 | cDNA clone IMAGE:3879838 | large cell carcinoma | 5' read | | ||
| BE790712 | cDNA clone IMAGE:3936562 | small cell carcinoma | 5' read | | ||
| BF797956 | cDNA clone IMAGE:4342146 | lymphoma, cell line | 5' read | | ||
| BG392721 | cDNA clone IMAGE:4539810 | embryonal carcinoma, cell line | 5' read | | ||
| BE294508 | cDNA clone IMAGE:3528996 | rhabdomyosarcoma | 5' read | | ||
| BE019037 | cDNA clone IMAGE:3009681 | rhabdomyosarcoma | 5' read | | ||
| AA249462 | cDNA clone (no-name) | heart | 5' read | |||
| BE295522 | cDNA clone IMAGE:3530863 | rhabdomyosarcoma | 5' read | |||
| AA093691 | cDNA clone (no-name) | heart | 5' read | |