

| Candidate UniGene cluster: | UniGene Cluster Hs.20621 |
| Description: | gamma tubulin ring complex protein (76p gene) |
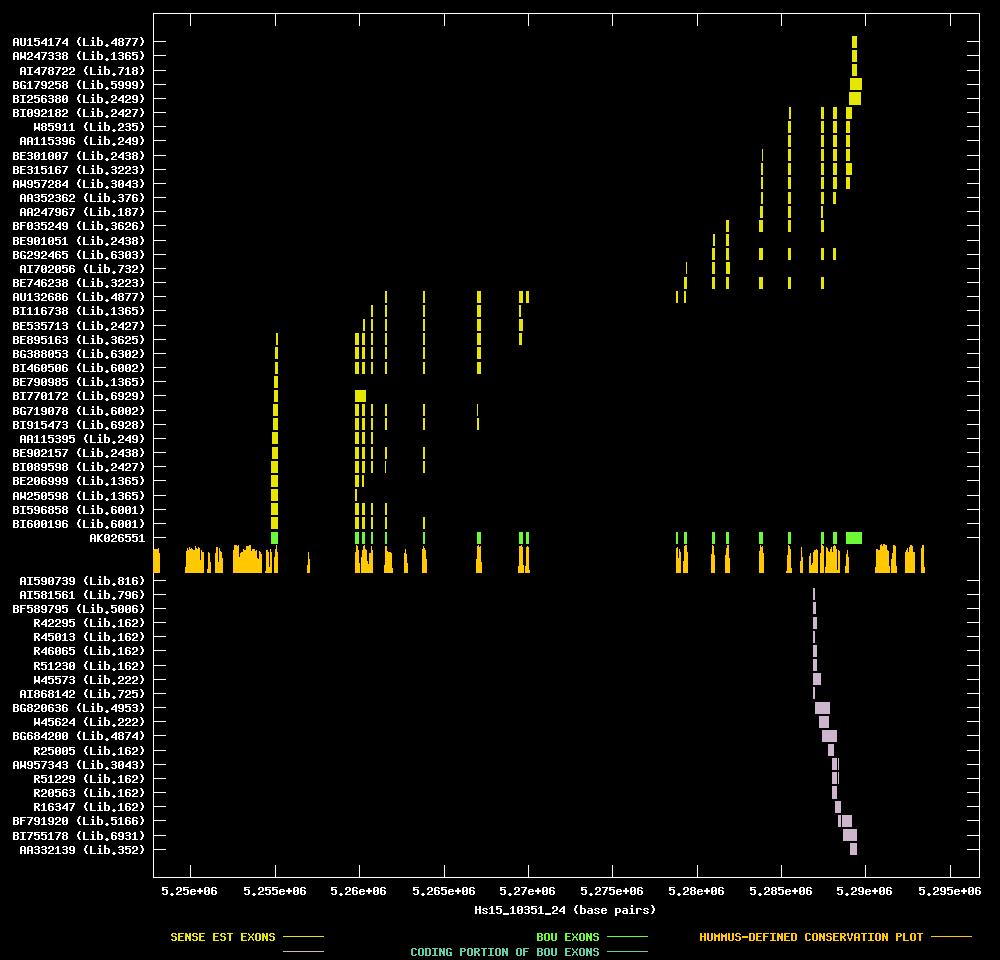
| Best-Of-UniGene (BOU) Sequence | AK026551 |
| Genomic Coordiantes Displayed: | Bases 5247780 to 5296735 of contig Hs15_10351_24 |
| BOU Orientation Along Contig: | LEFT-TO-RIGHT with respect to contig |
| Link to JPEG of genomic mapping | Hs.20621.jpeg |
| Best sense EST/protein match: | AU132686 matched ref|NP_055259.1| (NM_014444) gamma tubulin ring complex protein (76p gene) [Homo (E = e-118) |
| Best antisense EST/protein match: | No protein match with an e-value of less than 1e-10 |
ANTISENSE ESTs
| AI590739 | cDNA clone IMAGE:2260029 | tumor, 5 pooled (see description) | 3' read | 0.9 kb | ||
| AI581561 | cDNA clone IMAGE:2173100 | colon | 3' read | | ||
| BF589795 | cDNA clone IMAGE:3394086 | sciatic nerve | 3' read | | ||
| R42295 | cDNA clone IMAGE:29600 | brain | 3' read | 1.7 kb | | |
| R45013 | cDNA clone IMAGE:34314 | brain | 3' read | 1.4 kb | | |
| R46065 | cDNA clone IMAGE:35920 | brain | 3' read | | ||
| R51230 | cDNA clone IMAGE:38514 | brain | 3' read | 1.7 kb | | |
| W45573 | cDNA clone IMAGE:323476 | 3' read | 1.2 kb | | ||
| AI868142 | cDNA clone IMAGE:2186145 | stomach | 3' read | 2.5 kb | | |
| BG820636 | cDNA clone IMAGE:4933879 | anaplastic oligodendroglioma with 1p/19q loss | 5' read | |||
| W45624 | cDNA clone IMAGE:323476 | 5' read | 1.2 kb | |||
| BG684200 | cDNA clone IMAGE:4763671 | primary b-cells from tonsils (cell line) | 5' read | |||
| R25005 | cDNA clone IMAGE:34314 | brain | 5' read | 1.4 kb | ||
| AW957343 | cDNA clone (no-name) | | ||||
| R51229 | cDNA clone IMAGE:38514 | brain | 5' read | 1.7 kb | | |
| R20563 | cDNA clone IMAGE:35920 | brain | 5' read | | ||
| R16347 | cDNA clone IMAGE:29600 | brain | 5' read | 1.7 kb | ||
| BF791920 | cDNA clone IMAGE:4344573 | adrenal cortex carcinoma, cell line | 5' read | |||
| BI755178 | cDNA clone IMAGE:5193827 | brain | 5' read | |||
| AA332139 | cDNA clone ATCC:133783 | whole embryo | 5' read |
| BI600196 | cDNA clone IMAGE:5287968 | hypothalamus, cell line | 5' read | | ||
| BI596858 | cDNA clone IMAGE:5285799 | hypothalamus, cell line | 5' read | |||
| AW250598 | cDNA clone IMAGE:2821891 | small cell carcinoma | 5' read | |||
| BE206999 | cDNA clone IMAGE:2823687 | small cell carcinoma | 5' read | | ||
| BI089598 | cDNA clone IMAGE:4996025 | placenta | 5' read | | ||
| BE902157 | cDNA clone IMAGE:3959078 | choriocarcinoma | 5' read | |||
| AA115395 | cDNA clone IMAGE:511678 | 5' read | 2.6 kb | | ||
| BI915473 | cDNA clone IMAGE:5241697 | brain | 5' read | |||
| BG719078 | cDNA clone IMAGE:4831176 | testis, cell line | 5' read | | ||
| BI770172 | cDNA clone IMAGE:5202885 | pooled lung and spleen | 5' read | |||
| BE790985 | cDNA clone IMAGE:3940649 | small cell carcinoma | 5' read | |||
| BI460506 | cDNA clone IMAGE:5267187 | testis, cell line | 5' read | | ||
| BG388053 | cDNA clone IMAGE:4521672 | embryonal carcinoma, cell line | 5' read | | ||
| BE895163 | cDNA clone IMAGE:3921095 | melanotic melanoma | 5' read | | ||
| BE535713 | cDNA clone IMAGE:3446803 | placenta | 5' read | | ||
| BI116738 | cDNA clone IMAGE:5016847 | small cell carcinoma | 5' read | |||
| AU132686 | cDNA clone NT2RP4000355 | 5' read | | |||
| BE746238 | cDNA clone IMAGE:3928420 | adenocarcinoma cell line | 5' read | | ||
| AI702056 | cDNA clone IMAGE:2209412 | uterus | 3' read | 1.9 kb | ||
| BG292465 | cDNA clone IMAGE:4515599 | transitional cell papilloma, cell line | 5' read | | ||
| BE901051 | cDNA clone IMAGE:3956996 | choriocarcinoma | 5' read | |||
| BF035249 | cDNA clone IMAGE:3860625 | adenocarcinoma | 5' read | | ||
| AA247967 | cDNA clone (no-name) | heart | 5' read | | ||
| AA352362 | cDNA clone ATCC:152554 | 5' read | | |||
| AW957284 | cDNA clone (no-name) | | ||||
| BE315167 | cDNA clone IMAGE:3140735 | adenocarcinoma cell line | 5' read | | ||
| BE301007 | cDNA clone IMAGE:2906900 | choriocarcinoma | 3' read | | ||
| AA115396 | cDNA clone IMAGE:511678 | 3' read | 2.6 kb | | ||
| W85911 | cDNA clone IMAGE:415677 | pool | 3' read | 1.2 kb | | |
| BI092182 | cDNA clone IMAGE:4997741 | placenta | 5' read | |||
| BI256380 | cDNA clone IMAGE:5114395 | choriocarcinoma | 5' read | | ||
| BG179258 | cDNA clone IMAGE:4432309 | adenocarcinoma, cell line | 5' read | | ||
| AI478722 | cDNA clone IMAGE:2155348 | colon | 3' read | 1.8 kb | ||
| AW247338 | cDNA clone IMAGE:2819286 | small cell carcinoma | 3' read | |||
| AU154174 | cDNA clone NT2RP4000355 | 3' read |