
| Candidate UniGene cluster: | UniGene Cluster Hs.211601 |
| Description: | mitogen-activated protein kinase kinase kinase 12 |
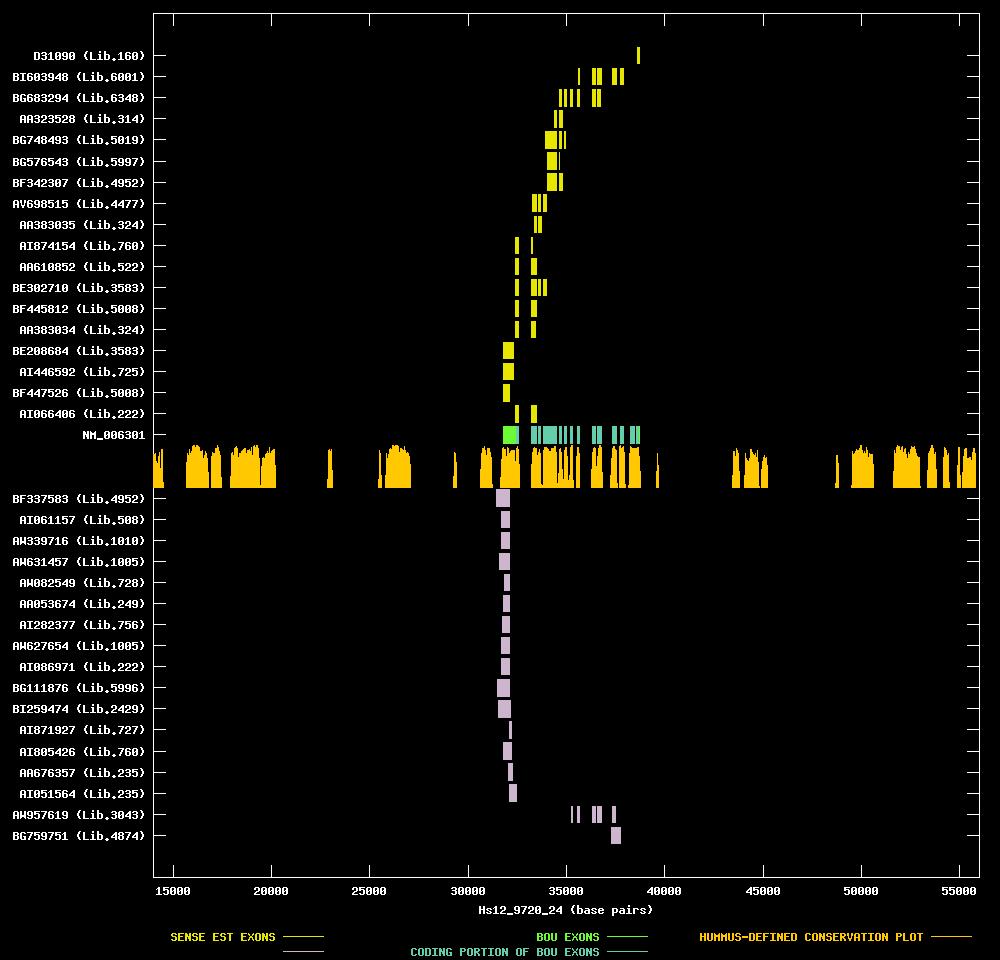
| Best-Of-UniGene (BOU) Sequence | NM_006301 |
| Genomic Coordiantes Displayed: | Bases 14000 to 56000 of contig Hs12_9720_24 |
| BOU Orientation Along Contig: | RIGHT-TO-LEFT with respect to contig |
| Link to JPEG of genomic mapping | Hs.211601.jpeg |
| Best sense EST/protein match: | BG683294 matched ref|XP_006800.3| (XM_006800) mitogen-activated protein kinase kinase kinase 12 [Homo (E = e-111) |
| Best antisense EST/protein match: | No protein match with an e-value of less than 1e-10 |
ANTISENSE ESTs
| BF337583 | cDNA clone IMAGE:4183281 | glioblastoma with egfr amplification | 5' read | |||
| AI061157 | cDNA clone IMAGE:1699674 | kidney | 3' read | |||
| AW339716 | cDNA clone IMAGE:2919367 | myeloid cells, 18 pooled cml cases, bcr/abl rearrangement | 3' read | |||
| AW631457 | cDNA clone IMAGE:2970010 | 2 pooled high-grade transitional cell tumors | 5' read | |||
| AW082549 | cDNA clone IMAGE:2579766 | esophagus | 3' read | |||
| AA053674 | cDNA clone IMAGE:510396 | 3' read | 1.1 kb | |||
| AI282377 | cDNA clone IMAGE:1980548 | kidney | 3' read | 1.2 kb | ||
| AW627654 | cDNA clone IMAGE:2970010 | 2 pooled high-grade transitional cell tumors | 3' read | |||
| AI086971 | cDNA clone IMAGE:1680137 | 3' read | 0.8 kb | |||
| BG111876 | cDNA clone IMAGE:4370948 | osteosarcoma, cell line | 5' read | |||
| BI259474 | cDNA clone IMAGE:5109601 | choriocarcinoma | 5' read | |||
| AI871927 | cDNA clone IMAGE:2439680 | uterus | 3' read | 2.1 kb | ||
| AI805426 | cDNA clone IMAGE:2277428 | uterus | 3' read | 0.5 kb | ||
| AA676357 | cDNA clone IMAGE:431587 | pool | 3' read | |||
| AI051564 | cDNA clone IMAGE:1673768 | pool | 3' read | 1.0 kb | ||
| AW957619 | cDNA clone (no-name) | | ||||
| BG759751 | cDNA clone IMAGE:4851397 | primary b-cells from tonsils (cell line) | 5' read | |