
| Candidate UniGene cluster: | UniGene Cluster Hs.22824 |
| Description: | MYB binding protein (P160) 1a |
| Best-Of-UniGene (BOU) Sequence | NM_014520 |
| Genomic Coordiantes Displayed: | Bases 216000 to 244000 of contig Hs17_10980_24 |
| BOU Orientation Along Contig: | RIGHT-TO-LEFT with respect to contig |
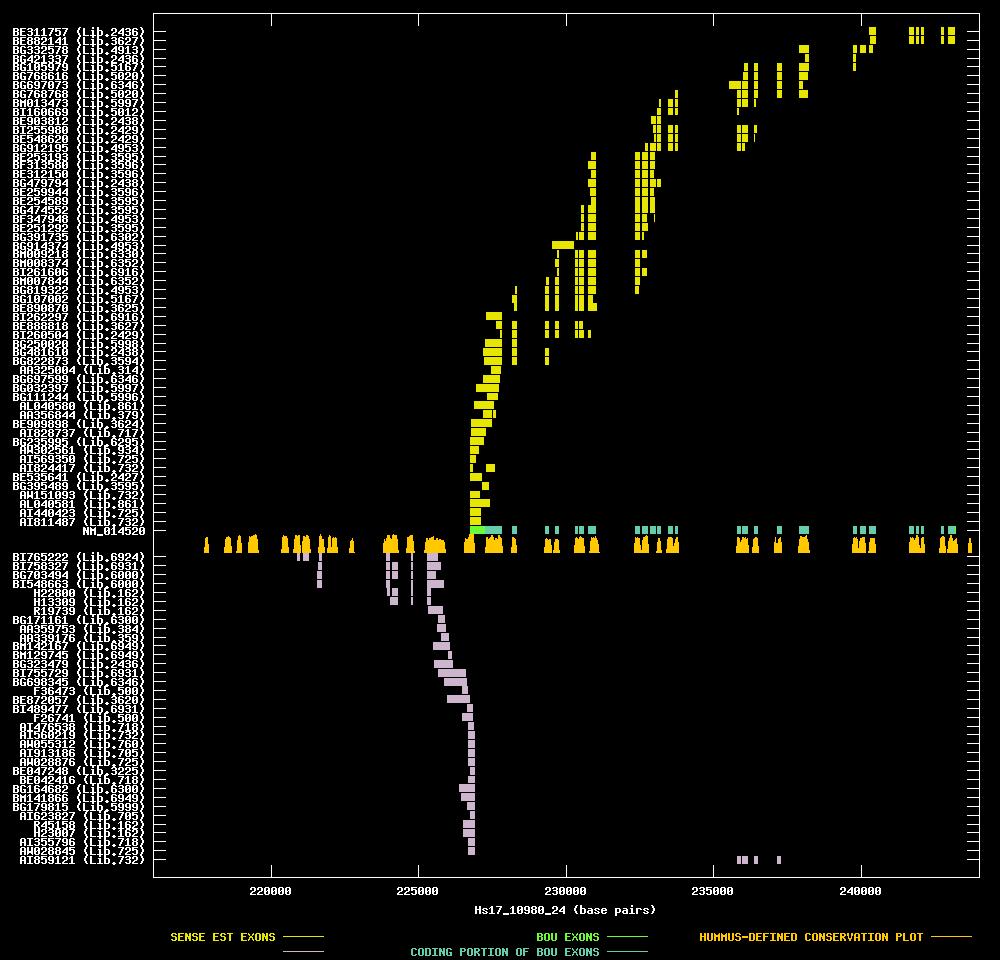
| Link to JPEG of genomic mapping | Hs.22824.jpeg |
| Best sense EST/protein match: | BE888818 matched ref|NP_055335.1| (NM_014520) MYB binding protein (P160) 1a [Homo sapiens] (E = e-105) |
| Best antisense EST/protein match: | BI765222 matched gb|AAH11467.1|AAH11467 (BC011467) Unknown (protein for IMAGE:3154539) [Mus musculus] (E = 2e-77) |
ANTISENSE ESTs
| BI765222 | cDNA clone IMAGE:5190696 | pooled colon, kidney, stomach | 5' read | | ||
| BI758327 | cDNA clone IMAGE:5200293 | brain | 5' read | | ||
| BG703494 | cDNA clone IMAGE:4818950 | hippocampus, cell line | 5' read | | ||
| BI548663 | cDNA clone IMAGE:5276214 | hippocampus, cell line | 5' read | | ||
| H22800 | cDNA clone IMAGE:52363 | brain | 5' read | 2.0 kb | ||
| H13309 | cDNA clone IMAGE:43360 | brain | 5' read | 1.7 kb | ||
| R19739 | cDNA clone IMAGE:34833 | brain | 5' read | 1.6 kb | ||
| BG171161 | cDNA clone IMAGE:4427240 | hypernephroma, cell line | 5' read | |||
| AA359753 | cDNA clone ATCC:163872 | lung | 5' read | |||
| AA339176 | cDNA clone ATCC:140895 | brain | 5' read | |||
| BM142167 | cDNA clone (no-name) | islets of langerhans | 5' read | |||
| BM129745 | cDNA clone (no-name) | islets of langerhans | 5' read | |||
| BG323479 | cDNA clone IMAGE:4559910 | renal cell adenocarcinoma | 5' read | |||
| BI755729 | cDNA clone IMAGE:5195505 | brain | 5' read | |||
| BG698345 | cDNA clone IMAGE:4801426 | skin | 5' read | |||
| F36473 | cDNA clone sH5000014-0/D10 | muscle | ||||
| BE872057 | cDNA clone IMAGE:3852058 | adenocarcinoma | 5' read | |||
| BI489477 | cDNA clone IMAGE:5191777 | brain | 3' read |