

| Candidate UniGene cluster: | UniGene Cluster Hs.247118 |
| Description: | phosphatidylinositol glycan, class B |
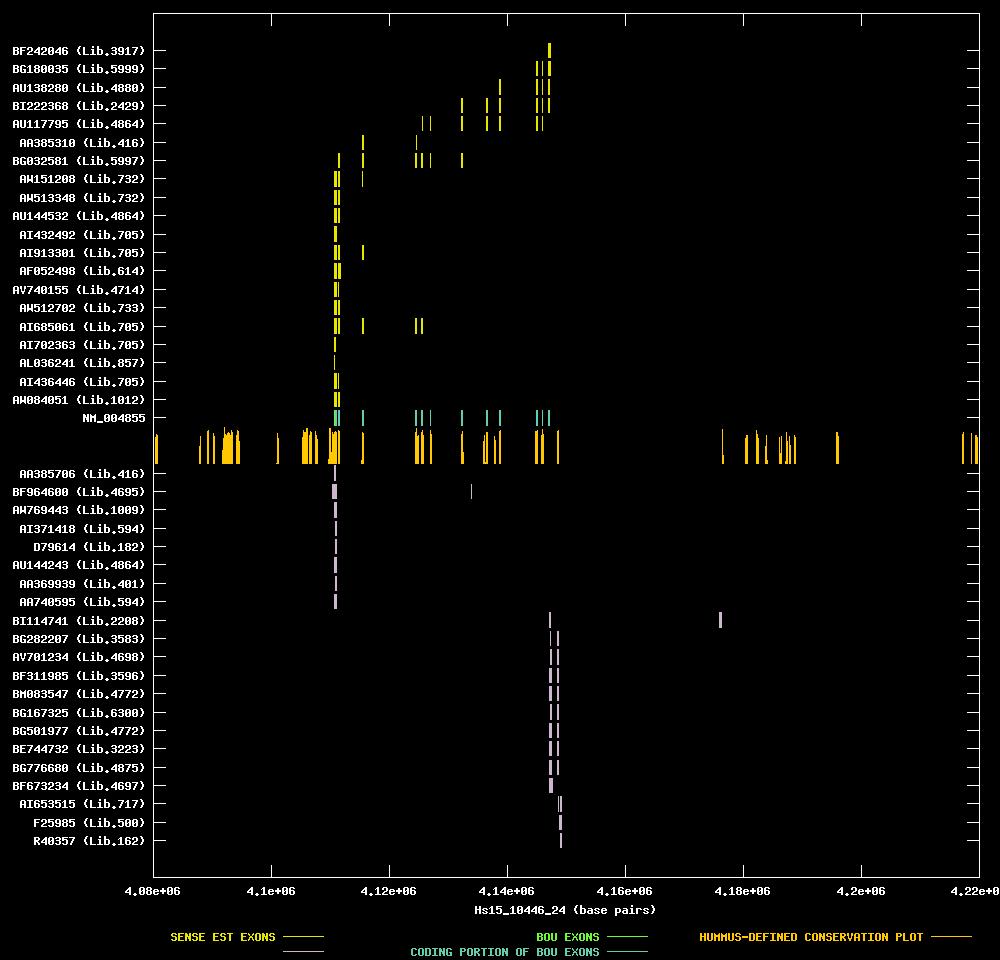
| Best-Of-UniGene (BOU) Sequence | NM_004855 |
| Genomic Coordiantes Displayed: | Bases 4080000 to 4220000 of contig Hs15_10446_24 |
| BOU Orientation Along Contig: | RIGHT-TO-LEFT with respect to contig |
| Link to JPEG of genomic mapping | Hs.247118.jpeg |
| Best sense EST/protein match: | AU117795 matched ref|NP_004846.1| (NM_004855) phosphatidylinositol glycan, class B [Homo sapiens] (E = e-153) |
| Best antisense EST/protein match: | No protein match with an e-value of less than 1e-10 |
ANTISENSE ESTs
| AA385706 | cDNA clone ATCC:189881 | thyroid | 5' read | |||
| BF964600 | cDNA clone IMAGE:4356147 | muscle (skeletal) | 5' read | | ||
| AW769443 | cDNA clone IMAGE:3005932 | 2 pooled wilms' tumors, one primary and one metastatic to | 3' read | | ||
| AI371418 | cDNA clone IMAGE:1915221 | kidney | 3' read | 1.4 kb | | |
| D79614 | cDNA clone GEN289G03 | aorta | 5' read | | ||
| AU144243 | cDNA clone HEMBA1001328 | whole embryo, mainly head | 3' read | | ||
| AA369939 | cDNA clone ATCC:174490 | prostate | 3' read | | ||
| AA740595 | cDNA clone IMAGE:1325345 | kidney | 3' read | 0.8 kb | | |
| BI114741 | cDNA clone IMAGE:5020915 | rhabdomyosarcoma | 5' read | | ||
| BG282207 | cDNA clone IMAGE:4545614 | melanotic melanoma | 5' read | |||
| AV701234 | cDNA clone ADAAGC11 | adrenal gland | 5' read | | ||
| BF311985 | cDNA clone IMAGE:4127264 | neuroblastoma | 5' read | | ||
| BM083547 | cDNA clone IMAGE:4654489 | embryonal carcinoma | 5' read | |||
| BG167325 | cDNA clone IMAGE:4452656 | hypernephroma, cell line | 5' read | |||
| BG501977 | cDNA clone IMAGE:4654489 | embryonal carcinoma | 5' read | |||
| BE744732 | cDNA clone IMAGE:3834175 | adenocarcinoma cell line | 5' read | |||
| BG776680 | cDNA clone IMAGE:4809106 | mucoepidermoid carcinoma | 5' read | | ||
| BF673234 | cDNA clone IMAGE:4272616 | prostate | 5' read | |||
| AI653515 | cDNA clone IMAGE:2216558 | ovary | 3' read | 1.0 kb | | |
| F25985 | cDNA clone s4000046E03 | muscle | | |||
| R40357 | cDNA clone IMAGE:28705 | brain | 3' read | 1.0 kb | |
| AW084051 | cDNA clone IMAGE:2585364 | moderately differentiated adenocarcinoma | 3' read | | ||
| AI436446 | cDNA clone IMAGE:2129954 | pancreas | 3' read | 0.9 kb | | |
| AL036241 | cDNA clone DKFZp564K012 | brain | 5' read | |||
| AI702363 | cDNA clone IMAGE:2293547 | pancreas | 3' read | 2.3 kb | | |
| AI685061 | cDNA clone IMAGE:2323670 | pancreas | 3' read | 2.2 kb | | |
| AW512702 | cDNA clone IMAGE:2703147 | uterus | 3' read | | ||
| AV740155 | cDNA clone CBLAIF12 | cord blood | 5' read | | ||
| AF052498 | cDNA clone RA49 | lung | | |||
| AI913301 | cDNA clone IMAGE:2294486 | pancreas | 3' read | 0.9 kb | | |
| AI432492 | cDNA clone IMAGE:2120312 | pancreas | 3' read | 0.9 kb | | |
| AU144532 | cDNA clone HEMBA1002196 | whole embryo, mainly head | 3' read | | ||
| AW513348 | cDNA clone IMAGE:2706783 | uterus | 3' read | | ||
| AW151208 | cDNA clone IMAGE:2629454 | uterus | 3' read | | ||
| BG032581 | cDNA clone IMAGE:4392553 | mammary adenocarcinoma, cell line | 5' read | | ||
| AA385310 | cDNA clone ATCC:189478 | thyroid | 5' read | | ||
| AU117795 | cDNA clone HEMBA1002196 | whole embryo, mainly head | 5' read | | ||
| BI222368 | cDNA clone IMAGE:5103123 | choriocarcinoma | 5' read | | ||
| AU138280 | cDNA clone PLACE1008247 | placenta | 5' read | | ||
| BG180035 | cDNA clone IMAGE:4430974 | adenocarcinoma, cell line | 5' read | | ||
| BF242046 | cDNA clone IMAGE:4108443 | from acute myelogenous leukemia | 5' read |