

| Candidate UniGene cluster: | UniGene Cluster Hs.268024 |
| Description: | Homo sapiens, clone IMAGE:3873720, mRNA |
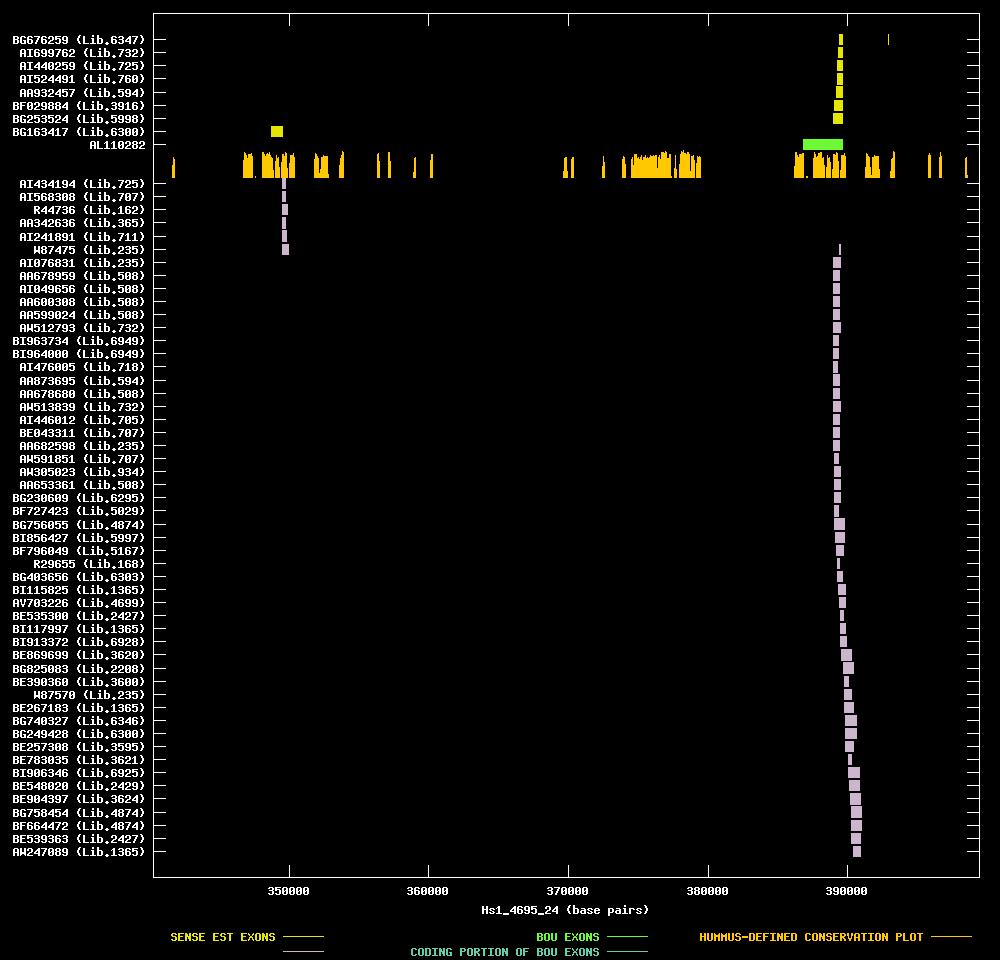
| Best-Of-UniGene (BOU) Sequence | AL110282 |
| Genomic Coordiantes Displayed: | Bases 340286 to 399413 of contig Hs1_4695_24 |
| BOU Orientation Along Contig: | LEFT-TO-RIGHT with respect to contig |
| Link to JPEG of genomic mapping | Hs.268024.jpeg |
| Best sense EST/protein match: | AL110282 matched ref|XP_033704.1| (XM_033704) hypothetical protein XP_033704 [Homo sapiens] (E = e-104) |
| Best antisense EST/protein match: | BE869699 matched ref|XP_072098.1| (XM_072098) hypothetical protein XP_072098 [Homo sapiens] (E = 7e-44) |
ANTISENSE ESTs
| AI434194 | cDNA clone IMAGE:2132089 | stomach | 3' read | 1.4 kb | ||
| AI568308 | cDNA clone IMAGE:2174716 | lymph | 3' read | 3.2 kb | ||
| R44736 | cDNA clone IMAGE:34137 | brain | 3' read | 1.4 kb | | |
| AA342636 | cDNA clone ATCC:144366 | spleen | 3' read | | ||
| AI241891 | cDNA clone IMAGE:1977459 | brain | 3' read | 1.8 kb | | |
| W87475 | cDNA clone IMAGE:417133 | pool | 3' read | 2.4 kb | ||
| AI076831 | cDNA clone IMAGE:1674060 | pool | 3' read | 1.1 kb | | |
| AA678959 | cDNA clone IMAGE:1156187 | kidney | 3' read | | ||
| AI049656 | cDNA clone IMAGE:1700315 | kidney | 3' read | | ||
| AA600308 | cDNA clone IMAGE:1069323 | kidney | 3' read | 0.8 kb | | |
| AA599024 | cDNA clone IMAGE:898422 | kidney | 3' read | 3.1 kb | | |
| AW512793 | cDNA clone IMAGE:2792499 | uterus | 3' read | | ||
| BI963734 | cDNA clone (no-name) | islets of langerhans | 3' read | | ||
| BI964000 | cDNA clone (no-name) | islets of langerhans | 5' read | | ||
| AI476005 | cDNA clone IMAGE:2154952 | colon | 3' read | 1.5 kb | | |
| AA873695 | cDNA clone IMAGE:1325824 | kidney | 3' read | | ||
| AA678680 | cDNA clone IMAGE:1155410 | kidney | 3' read | | ||
| AW513839 | cDNA clone IMAGE:2707362 | uterus | 3' read | | ||
| AI446012 | cDNA clone IMAGE:2143244 | pancreas | 3' read | 2.8 kb | | |
| BE043311 | cDNA clone IMAGE:3000093 | lymph | 3' read | | ||
| AA682598 | cDNA clone IMAGE:450838 | pool | 3' read | | ||
| AW591851 | cDNA clone IMAGE:2850570 | lymph | 3' read | |||
| AW305023 | cDNA clone IMAGE:2826555 | three pooled meningiomas | 3' read | |||
| AA653361 | cDNA clone IMAGE:1127848 | kidney | 3' read | |||
| BG230609 | cDNA clone IMAGE:4143323 | lymphocyte | 3' read | |||
| BF727423 | cDNA clone by21c04 | lens | 5' read | | ||
| BG756055 | cDNA clone IMAGE:4856602 | primary b-cells from tonsils (cell line) | 5' read | |||
| BI856427 | cDNA clone IMAGE:5396567 | mammary adenocarcinoma, cell line | 5' read | |||
| BF796049 | cDNA clone IMAGE:4342265 | lymphoma, cell line | 5' read | |||
| R29655 | cDNA clone F11177D | liver | 5' read | |||
| BG403656 | cDNA clone IMAGE:4526370 | transitional cell papilloma, cell line | 5' read | |||
| BI115825 | cDNA clone IMAGE:5014580 | small cell carcinoma | 5' read | |||
| AV703226 | cDNA clone ADBAFD07 | adrenal gland | 5' read | |||
| BE535300 | cDNA clone IMAGE:3445162 | placenta | 5' read | |||
| BI117997 | cDNA clone IMAGE:5015893 | small cell carcinoma | 5' read | |||
| BI913372 | cDNA clone IMAGE:5243126 | brain | 5' read | |||
| BE869699 | cDNA clone IMAGE:3849507 | adenocarcinoma | 5' read | |||
| BG825083 | cDNA clone IMAGE:4900188 | rhabdomyosarcoma | 5' read | |||
| BE390360 | cDNA clone IMAGE:3613416 | endometrium, adenocarcinoma cell line | 5' read | |||
| W87570 | cDNA clone IMAGE:417133 | pool | 5' read | 2.4 kb | ||
| BE267183 | cDNA clone IMAGE:3534490 | small cell carcinoma | 5' read | |||
| BG740327 | cDNA clone IMAGE:4780314 | skin | 5' read | |||
| BG249428 | cDNA clone IMAGE:4470009 | hypernephroma, cell line | 5' read | |||
| BE257308 | cDNA clone IMAGE:3344883 | retinoblastoma | 5' read | |||
| BE783035 | cDNA clone IMAGE:3873720 | retinoblastoma | 5' read | |||
| BI906346 | cDNA clone IMAGE:5212325 | leukocyte | 5' read | | ||
| BE548020 | cDNA clone IMAGE:3458170 | choriocarcinoma | 5' read | |||
| BE904397 | cDNA clone IMAGE:3898443 | epithelioid carcinoma | 5' read | | ||
| BG758454 | cDNA clone IMAGE:4853076 | primary b-cells from tonsils (cell line) | 5' read | |||
| BF664472 | cDNA clone IMAGE:4309876 | primary b-cells from tonsils (cell line) | 5' read | | ||
| BE539363 | cDNA clone IMAGE:3451552 | placenta | 5' read | |||
| AW247089 | cDNA clone IMAGE:2822458 | small cell carcinoma | 5' read |
| BG163417 | cDNA clone IMAGE:4446335 | hypernephroma, cell line | 5' read | |||
| BG253524 | cDNA clone IMAGE:4472605 | adenocarcinoma, cell line | 5' read | |||
| BF029884 | cDNA clone IMAGE:3827120 | hypernephroma | 5' read |