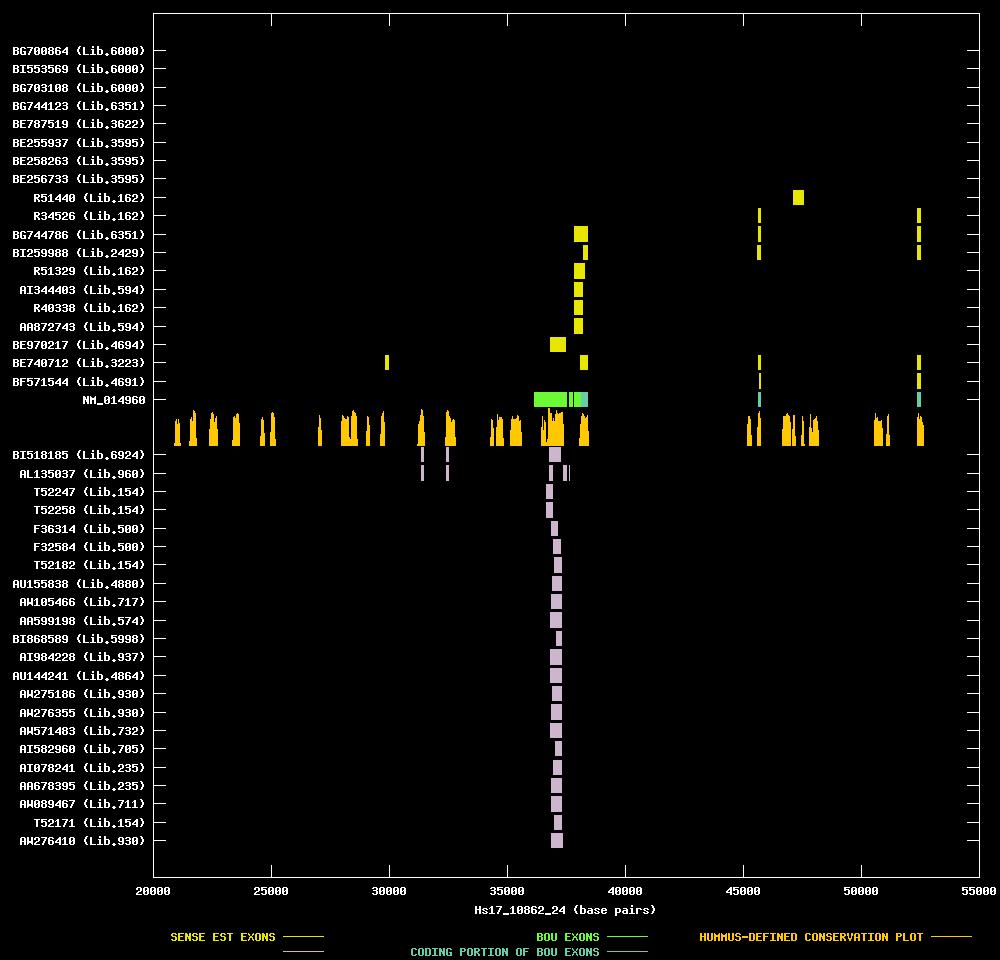
Computational Discovery of Overlapping Transcriptional Units in the Human & Mouse Genomes

Candidate UniGene cluster:UniGene Cluster Hs.279937
Description:KIAA1001 protein
Best-Of-UniGene (BOU) SequenceNM_014960
Genomic Coordiantes Displayed:Bases 20000 to 55000 of contig Hs17_10862_24
BOU Orientation Along Contig:RIGHT-TO-LEFT with respect to contig
Link to JPEG of genomic mappingHs.279937.jpeg
Best sense EST/protein match:BE255937 matched ref|NP_055775.1| (NM_014960) KIAA1001 protein [Homo sapiens] (E = e-112)
Best antisense EST/protein match:AL135037 matched ref|NP_060453.1| (NM_017983) hypothetical protein FLJ10055 [Homo sapiens] (E = 3e-41)


This page provides information on exon-intron structure, mouse-human homologies, polyA signals & locations, and protein homologies of ESTs from directionally-cloned libraries that are members of a UniGene cluster that is a candidate for containing ESTs derived from distinct, overlapping sense & antisense transcripts.
The upper portion of the graph is reserved for the exon-intron mappings of ESTs oriented consistently with the Best-Of-UniGene (BOU) sequence (in gold). The lower portion of the graph is reserved for the exon-intron mappings of ESTs oriented opposite the BOU sequence (in white). Dividing these portions are the exon-intron mapping of the BOU sequence itself (in blue and green). Immedietely below the BOU are HUMMUS-defined streches of sequences highly conserved between mouse and human. The height of each bar is reflective of the % identity of human-mouse homology over a 100 base-pair window centered at a given base. At the left of the graph, the GenBank accession number of the BOU or EST sequence represented along that Y-axis position is listed, along with the UniLib identification number of the library from which that EST was derived.Below the graph, the GenBank accession numbers of each of the sense & antisense ESTs are provided, along with information on which have polyA signals and protein homologies, as determined by the NCBI.

Below are listed the same set of ESTs as is depicted above, with information of read direction, tissue type, protein similarity (P), and poly-adenylation signal (A).

ANTISENSE ESTs
  BI518185 cDNA clone IMAGE:5182606 pooled colon, kidney, stomach 3' read
  AL135037 cDNA clone DKFZp762M1011 melanoma (mewo cell line) 5' read
  T52247 cDNA clone IMAGE:71926 spleen 5' read 0.8 kb
  T52258 cDNA clone IMAGE:71927 spleen 5' read 0.8 kb
  F36314 cDNA clone sH4000004-1/F03 muscle
  F32584 cDNA clone s3000042F03 muscle
  T52182 cDNA clone IMAGE:71927 spleen 3' read 0.8 kb
  AU155838 cDNA clone PLACE1001267 placenta 3' read Polyadenylation signal
  AW105466 cDNA clone IMAGE:2597457 ovary 3' read Polyadenylation signal
  AA599198 cDNA clone IMAGE:1091418 bone 3' read 1.3 kbPolyadenylation signal
  BI868589 cDNA clone IMAGE:5402497 adenocarcinoma, cell line 5' read Polyadenylation signal
  AI984228 cDNA clone IMAGE:2562159 four pooled poorly-differentiated adenocarcinomas 3' read 1.3 kbPolyadenylation signal
  AU144241 cDNA clone HEMBA1001326 whole embryo, mainly head 3' read Polyadenylation signal
  AW275186 cDNA clone IMAGE:2819138 two pooled squamous cell carcinomas 3' read Polyadenylation signal
  AW276355 cDNA clone IMAGE:2759833 two pooled squamous cell carcinomas 3' read Polyadenylation signal
  AW571483 cDNA clone IMAGE:2839122 uterus 3' read Polyadenylation signal
  AI582960 cDNA clone IMAGE:2227137 pancreas 3' read 2.0 kbPolyadenylation signal
  AI078241 cDNA clone IMAGE:1675936 pool 3' read 1.1 kbPolyadenylation signal
  AA678395 cDNA clone IMAGE:432048 pool 3' read Polyadenylation signal
  AW089467 cDNA clone IMAGE:2591493 brain 3' read Polyadenylation signal
  T52171 cDNA clone IMAGE:71926 spleen 3' read 0.8 kbPolyadenylation signal
  AW276410 cDNA clone IMAGE:2759953 two pooled squamous cell carcinomas 3' read Polyadenylation signal

SENSE ESTs

  BF571544 cDNA clone IMAGE:4252380 melanotic melanoma, high mdr 5' read
  BE740712 cDNA clone IMAGE:3947781 adenocarcinoma cell line 5' read Protein similarity
  BE970217 cDNA clone IMAGE:3950247 pancreas 5' read
  AA872743 cDNA clone IMAGE:1472826 kidney 3' read 1.1 kbPolyadenylation signal
  R40338 cDNA clone IMAGE:28699 brain 3' read 2.1 kb
  AI344403 cDNA clone IMAGE:1917876 kidney 3' read 1.2 kb
  R51329 cDNA clone IMAGE:38792 brain 3' read 1.9 kb
  BI259988 cDNA clone IMAGE:5111611 choriocarcinoma 5' read Protein similarity
  BG744786 cDNA clone IMAGE:4849394 natural killer cells, cell line 3' read
  R34526 cDNA clone IMAGE:37020 brain 5' read 1.0 kbProtein similarity
  R51440 cDNA clone IMAGE:38792 brain 5' read 1.9 kb
  BE256733 cDNA clone IMAGE:3356100 retinoblastoma 5' read Protein similarity
  BE258263 cDNA clone IMAGE:3356670 retinoblastoma 5' read Protein similarity
  BE255937 cDNA clone IMAGE:3354051 retinoblastoma 5' read Protein similarity
  BE787519 cDNA clone IMAGE:3882163 large cell carcinoma 5' read Protein similarity
  BG744123 cDNA clone IMAGE:4849394 natural killer cells, cell line 5' read
  BG703108 cDNA clone IMAGE:4818663 hippocampus, cell line 5' read
  BI553569 cDNA clone IMAGE:5277043 hippocampus, cell line 5' read
  BG700864 cDNA clone IMAGE:4814180 hippocampus, cell line 5' read