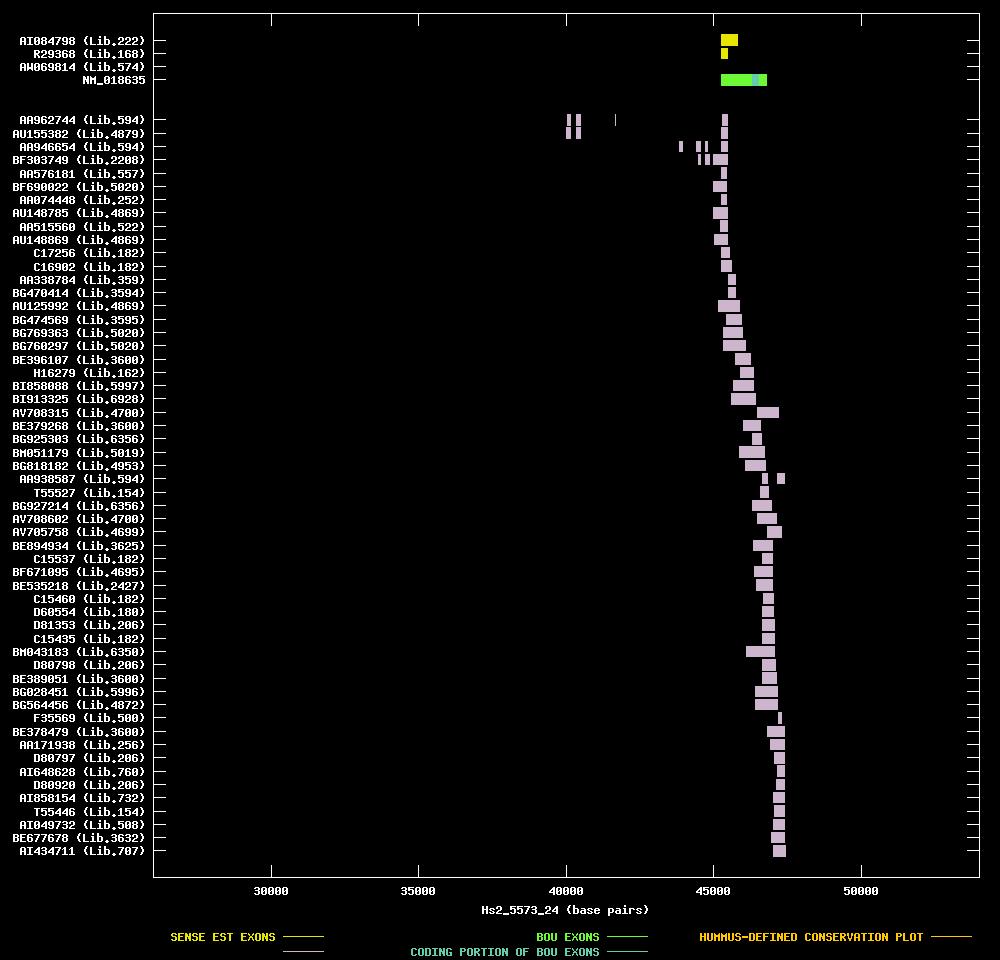
| Candidate UniGene cluster: | UniGene Cluster Hs.283473 |
| Description: | hypothetical protein PRO2900 |
| Best-Of-UniGene (BOU) Sequence | NM_018635 |
| Genomic Coordiantes Displayed: | Bases 26000 to 54000 of contig Hs2_5573_24 |
| BOU Orientation Along Contig: | RIGHT-TO-LEFT with respect to contig |
| Link to JPEG of genomic mapping | Hs.283473.jpeg |
| Best sense EST/protein match: | NM_018635 matched ref|NP_061105.1| (NM_018635) hypothetical protein PRO2900 [Homo sapiens] (E = 4e-37) |
| Best antisense EST/protein match: | AA946654 matched gb|AAH14305.1|AAH14305 (BC014305) Similar to high density lipoprotein binding protein (E = 2e-38) |
| |
AA962744 |
cDNA clone IMAGE:1573386 |
kidney |
3' read |
|
  |
| |
AU155382 |
cDNA clone OVARC1001823 |
ovary, tumor tissue |
3' read |
|
  |
| |
AA946654 |
cDNA clone IMAGE:1589142 |
kidney |
3' read |
0.4 kb |   |
| |
BF303749 |
cDNA clone IMAGE:4120517 |
rhabdomyosarcoma |
5' read |
|
 |
| |
AA576181 |
cDNA clone IMAGE:1072630 |
breast |
3' read |
|
|
| |
BF690022 |
cDNA clone IMAGE:4298522 |
melanotic melanoma, high mdr (cell line) |
3' read |
|
|
| |
AA074448 |
cDNA clone IMAGE:525848 |
|
3' read |
1.1 kb | |
| |
AU148785 |
cDNA clone NT2RM4000916 |
|
3' read |
|
 |
| |
AA515560 |
cDNA clone IMAGE:979504 |
lung |
3' read |
1.6 kb |  |
| |
AU148869 |
cDNA clone NT2RM4001106 |
|
3' read |
|
 |
| |
C17256 |
cDNA clone GEN542D03 |
aorta |
5' read |
|
|
| |
C16902 |
cDNA clone GEN534H02 |
aorta |
5' read |
|
|
| |
AA338784 |
cDNA clone ATCC:140640 |
brain |
5' read |
|
|
| |
BG470414 |
cDNA clone IMAGE:4660782 |
adenocarcinoma cell line |
5' read |
|
 |
| |
AU125992 |
cDNA clone NT2RM4002531 |
|
5' read |
|
|
| |
BG474569 |
cDNA clone IMAGE:4649316 |
retinoblastoma |
5' read |
|
|
| |
BG769363 |
cDNA clone IMAGE:4872203 |
melanotic melanoma, high mdr (cell line) |
5' read |
|
|
| |
BG760297 |
cDNA clone IMAGE:4840393 |
melanotic melanoma, high mdr (cell line) |
5' read |
|
|
| |
BE396107 |
cDNA clone IMAGE:3659194 |
endometrium, adenocarcinoma cell line |
5' read |
|
|
| |
H16279 |
cDNA clone IMAGE:49043 |
brain |
5' read |
0.8 kb | |
| |
BI858088 |
cDNA clone IMAGE:5392994 |
mammary adenocarcinoma, cell line |
5' read |
|
|
| |
BI913325 |
cDNA clone IMAGE:5244286 |
brain |
5' read |
|
|
| |
AV708315 |
cDNA clone ADCAQA03 |
adrenal gland |
5' read |
|
|
| |
BE379268 |
cDNA clone IMAGE:3608903 |
endometrium, adenocarcinoma cell line |
5' read |
|
 |
| |
BG925303 |
cDNA clone (no-name) |
cartilage |
|
|
|
| |
BM051179 |
cDNA clone IMAGE:5424986 |
normal pigmented retinal epithelium |
5' read |
|
|
| |
BG818182 |
cDNA clone IMAGE:4915167 |
anaplastic oligodendroglioma with 1p/19q loss |
5' read |
|
|
| |
AA938587 |
cDNA clone IMAGE:1574032 |
kidney |
3' read |
0.5 kb |  |
| |
T55527 |
cDNA clone IMAGE:73477 |
spleen |
5' read |
0.6 kb | |
| |
BG927214 |
cDNA clone (no-name) |
cartilage |
|
|
|
| |
AV708602 |
cDNA clone ADCAPF07 |
adrenal gland |
5' read |
|
|
| |
AV705758 |
cDNA clone ADBBGA09 |
adrenal gland |
5' read |
|
|
| |
BE894934 |
cDNA clone IMAGE:3920936 |
melanotic melanoma |
5' read |
|
|
| |
C15537 |
cDNA clone GEN150A01 |
aorta |
5' read |
|
|
| |
BF671095 |
cDNA clone IMAGE:4292069 |
muscle (skeletal) |
5' read |
|
|
| |
BE535218 |
cDNA clone IMAGE:3445263 |
placenta |
5' read |
|
|
| |
C15460 |
cDNA clone GEN146E12 |
aorta |
5' read |
|
|
| |
D60554 |
cDNA clone GEN116E06 |
brain |
5' read |
|
|
| |
D81353 |
cDNA clone GEN159A12 |
brain |
5' read |
|
|
| |
C15435 |
cDNA clone GEN145D03 |
aorta |
5' read |
|
|
| |
BM043183 |
cDNA clone IMAGE:5432774 |
carcinoma, cell line |
5' read |
|
|
| |
D80798 |
cDNA clone GEN107B01 |
brain |
5' read |
|
|
| |
BE389051 |
cDNA clone IMAGE:3613536 |
endometrium, adenocarcinoma cell line |
5' read |
|
|
| |
BG028451 |
cDNA clone IMAGE:4389158 |
osteosarcoma, cell line |
5' read |
|
|
| |
BG564456 |
cDNA clone IMAGE:4712640 |
liver |
5' read |
|
|
| |
F35569 |
cDNA clone s4v000160-0/C11 |
muscle |
|
|
|
| |
BE378479 |
cDNA clone IMAGE:3608465 |
endometrium, adenocarcinoma cell line |
5' read |
|
|
| |
AA171938 |
cDNA clone IMAGE:610410 |
|
3' read |
|
 |
| |
D80797 |
cDNA clone GEN107B01 |
brain |
3' read |
|
 |
| |
AI648628 |
cDNA clone IMAGE:2268352 |
uterus |
3' read |
|
 |
| |
D80920 |
cDNA clone GEN116E06 |
brain |
3' read |
|
 |
| |
AI858154 |
cDNA clone IMAGE:2427692 |
uterus |
3' read |
2.1 kb |  |
| |
T55446 |
cDNA clone IMAGE:73475 |
spleen |
3' read |
0.9 kb |  |
| |
AI049732 |
cDNA clone IMAGE:1700837 |
kidney |
3' read |
|
 |
| |
BE677678 |
cDNA clone IMAGE:3280221 |
dorsal root ganglia |
3' read |
|
 |
| |
AI434711 |
cDNA clone IMAGE:2132884 |
lymph |
3' read |
1.3 kb | |


