
| Candidate UniGene cluster: | UniGene Cluster Hs.283652 |
| Description: | uncharacterized hypothalamus protein HT009 |
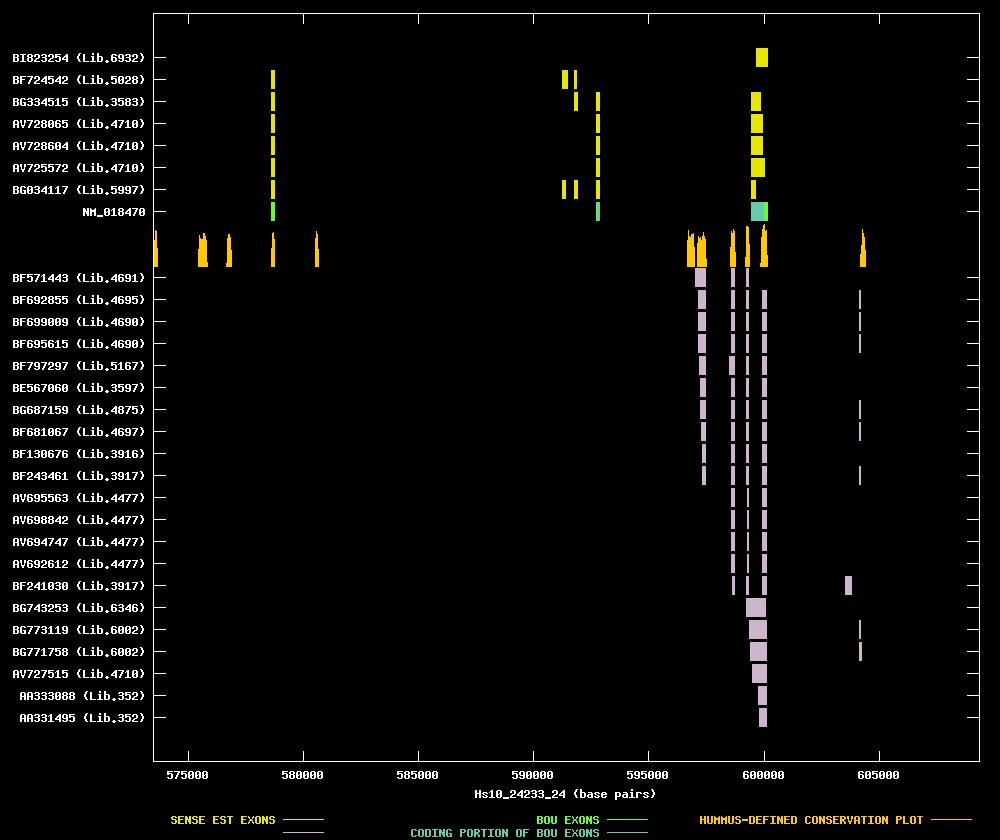
| Best-Of-UniGene (BOU) Sequence | NM_018470 |
| Genomic Coordiantes Displayed: | Bases 573482 to 609359 of contig Hs10_24233_24 |
| BOU Orientation Along Contig: | LEFT-TO-RIGHT with respect to contig |
| Link to JPEG of genomic mapping | Hs.283652.jpeg |
| Best sense EST/protein match: | NM_018470 matched ref|NP_060940.1| (NM_018470) uncharacterized hypothalamus protein HT009 [Homo (E = e-105) |
| Best antisense EST/protein match: | BF797297 matched ref|NP_004499.1| (NM_004508) isopentenyl-diphosphate delta isomerase; IPP isomerase (E = 3e-68) |
ANTISENSE ESTs
| BF571443 | cDNA clone IMAGE:4243948 | melanotic melanoma, high mdr | 5' read | | ||
| BF692855 | cDNA clone IMAGE:4244441 | muscle (skeletal) | 5' read | | ||
| BF699009 | cDNA clone IMAGE:4283403 | primitive neuroectoderm | 5' read | | ||
| BF695615 | cDNA clone IMAGE:4076312 | primitive neuroectoderm | 5' read | | ||
| BF797297 | cDNA clone IMAGE:4340570 | lymphoma, cell line | 5' read | | ||
| BE567060 | cDNA clone IMAGE:3683381 | carcinoma, cell line | 5' read | | ||
| BG687159 | cDNA clone IMAGE:4762701 | mucoepidermoid carcinoma | 5' read | | ||
| BF681067 | cDNA clone IMAGE:4296450 | prostate | 5' read | | ||
| BF130676 | cDNA clone IMAGE:4051386 | hypernephroma | 5' read | | ||
| BF243461 | cDNA clone IMAGE:4106491 | from acute myelogenous leukemia | 5' read | | ||
| AV695563 | cDNA clone GKCALB02 | hepatocellular carcinoma | 5' read | | ||
| AV698842 | cDNA clone GKCALE06 | hepatocellular carcinoma | 5' read | |