
| Candidate UniGene cluster: | UniGene Cluster Hs.315689 |
| Description: | Homo sapiens cDNA: FLJ22373 fis, clone HRC06741 |
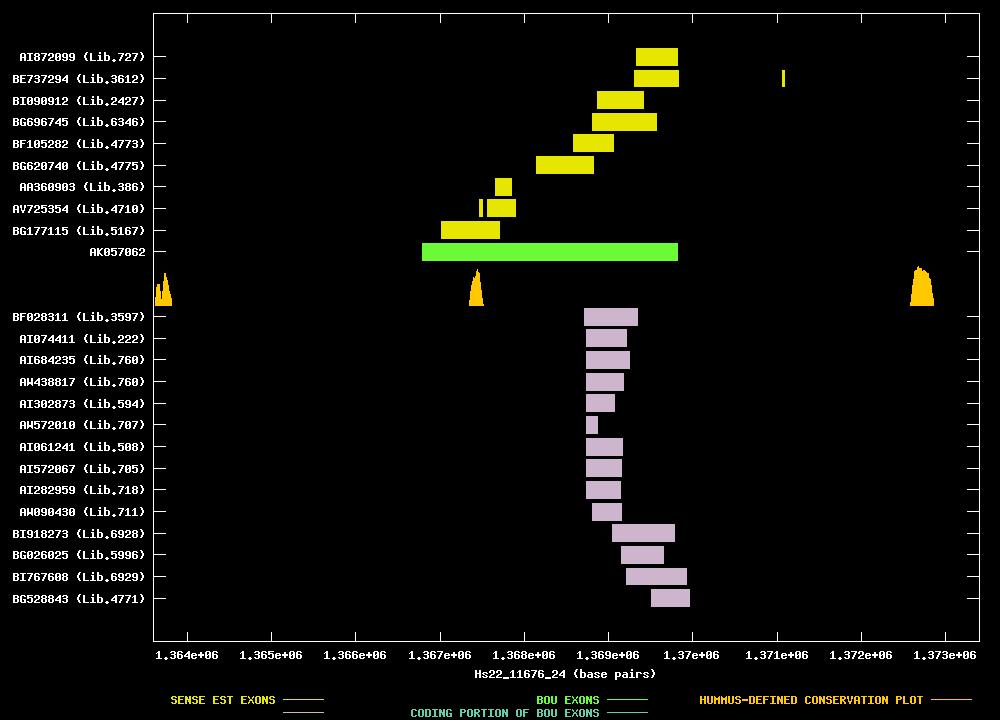
| Best-Of-UniGene (BOU) Sequence | AK057062 |
| Genomic Coordiantes Displayed: | Bases 1363600 to 1373400 of contig Hs22_11676_24 |
| BOU Orientation Along Contig: | LEFT-TO-RIGHT with respect to contig |
| Link to JPEG of genomic mapping | Hs.315689.jpeg |
| Best sense EST/protein match: | No protein match with an e-value of less than 1e-10 |
| Best antisense EST/protein match: | No protein match with an e-value of less than 1e-10 |
ANTISENSE ESTs
| BF028311 | cDNA clone IMAGE:3997175 | carcinoma, cell line | 5' read | |||
| AI074411 | cDNA clone IMAGE:1679230 | 3' read | 2.1 kb | | ||
| AI684235 | cDNA clone IMAGE:2275894 | uterus | 3' read | 1.2 kb | | |
| AW438817 | cDNA clone IMAGE:2778164 | uterus | 3' read | | ||
| AI302873 | cDNA clone IMAGE:1901512 | kidney | 3' read | |||
| AW572010 | cDNA clone IMAGE:2850692 | lymph | 3' read | | ||
| AI061241 | cDNA clone IMAGE:1700742 | kidney | 3' read | | ||
| AI572067 | cDNA clone IMAGE:2223936 | pancreas | 3' read | 1.5 kb | | |
| AI282959 | cDNA clone IMAGE:1961815 | colon | 3' read | 2.0 kb | | |
| AW090430 | cDNA clone IMAGE:2590799 | brain | 3' read | |||
| BI918273 | cDNA clone IMAGE:5247203 | brain | 5' read | |||
| BG026025 | cDNA clone IMAGE:4386960 | osteosarcoma, cell line | 5' read | |||
| BI767608 | cDNA clone IMAGE:5210049 | pooled lung and spleen | 5' read | |||
| BG528843 | cDNA clone IMAGE:4713608 | adenocarcinoma | 5' read |
| BG177115 | cDNA clone IMAGE:4419087 | lymphoma, cell line | 5' read | |||
| AV725354 | cDNA clone HTCAUH08 | hypothalamus | 5' read | |||
| AA360903 | cDNA clone ATCC:165046 | lymph | 5' read | |||
| BG620740 | cDNA clone IMAGE:4731490 | placenta | 5' read | |||
| BF105282 | cDNA clone IMAGE:4042577 | kidney | 5' read | |||
| BG696745 | cDNA clone IMAGE:4802850 | skin | 5' read | |||
| BI090912 | cDNA clone IMAGE:5000432 | placenta | 5' read | |||
| BE737294 | cDNA clone IMAGE:3641551 | adenocarcinoma | 5' read | |||
| AI872099 | cDNA clone IMAGE:2439839 | uterus | 3' read | 2.6 kb | |