| Candidate UniGene cluster: | UniGene Cluster Hs.334475 |
| Description: | hypothetical protein FLJ10634 |
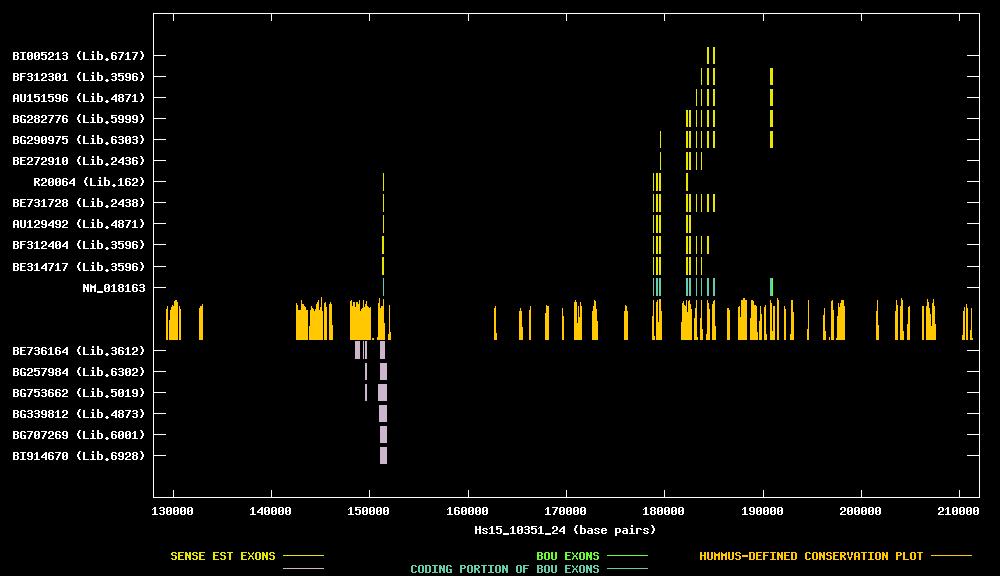
| Best-Of-UniGene (BOU) Sequence | NM_018163 |
| Genomic Coordiantes Displayed: | Bases 128000 to 212000 of contig Hs15_10351_24 |
| BOU Orientation Along Contig: | LEFT-TO-RIGHT with respect to contig |
| Link to JPEG of genomic mapping | Hs.334475.jpeg |
| Best sense EST/protein match: | NM_018163 matched ref|NP_060633.1| (NM_018163) hypothetical protein FLJ10634 [Homo sapiens] (E = e-115) |
| Best antisense EST/protein match: | BE736164 matched ref|NP_116239.1| (NM_032850) hypothetical protein FLJ14840 [Homo sapiens] (E = 5e-49) |