
| Candidate UniGene cluster: | UniGene Cluster Hs.334479 |
| Description: | KIAA1306 protein |
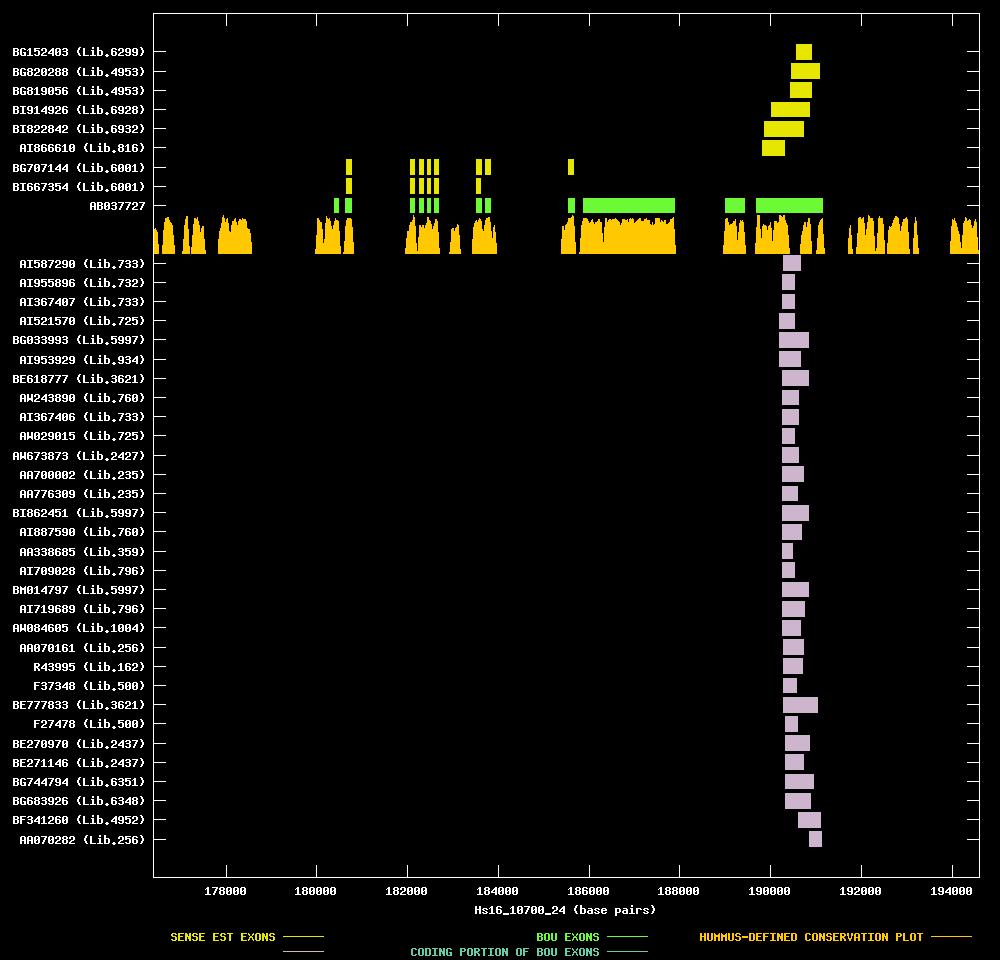
| Best-Of-UniGene (BOU) Sequence | AB037727 |
| Genomic Coordiantes Displayed: | Bases 176400 to 194600 of contig Hs16_10700_24 |
| BOU Orientation Along Contig: | LEFT-TO-RIGHT with respect to contig |
| Link to JPEG of genomic mapping | Hs.334479.jpeg |
| Best sense EST/protein match: | AB037727 matched dbj|BAA92544.1| (AB037727) KIAA1306 protein [Homo sapiens] (E = 0.0) |
| Best antisense EST/protein match: | AI719689 matched ref|XP_058763.1| (XM_058763) hypothetical protein XP_058763 [Homo sapiens] (E = 3e-48) |
ANTISENSE ESTs
| AI587290 | cDNA clone IMAGE:2207819 | uterus | 3' read | 1.5 kb | | |
| AI955896 | cDNA clone IMAGE:2509047 | uterus | 3' read | 1.8 kb | ||
| AI367407 | cDNA clone IMAGE:1991457 | uterus | 3' read | 0.9 kb | ||
| AI521570 | cDNA clone IMAGE:2183091 | stomach | 3' read | 2.0 kb | | |
| BG033993 | cDNA clone IMAGE:4402442 | mammary adenocarcinoma, cell line | 5' read | |||
| AI953929 | cDNA clone IMAGE:2549097 | three pooled meningiomas | 3' read | |||
| BE618777 | cDNA clone IMAGE:3866136 | retinoblastoma | 3' read | |||
| AW243890 | cDNA clone IMAGE:2708152 | uterus | 3' read | |||
| AI367406 | cDNA clone IMAGE:1991455 | uterus | 3' read | 0.5 kb | ||
| AW029015 | cDNA clone IMAGE:2542212 | stomach | 3' read | |||
| AW673873 | cDNA clone IMAGE:2900765 | placenta | 3' read | |||
| AA700002 | cDNA clone IMAGE:436023 | pool | 3' read | |||
| AA776309 | cDNA clone IMAGE:453697 | pool | 3' read | |||
| BI862451 | cDNA clone IMAGE:5406257 | mammary adenocarcinoma, cell line | 5' read | |||
| AI887590 | cDNA clone IMAGE:2436031 | uterus | 3' read | |||
| AA338685 | cDNA clone ATCC:140500 | brain | 3' read | |||
| AI709028 | cDNA clone IMAGE:2332374 | colon | 3' read | |||
| BM014797 | cDNA clone IMAGE:5416697 | mammary adenocarcinoma, cell line | 5' read | |||
| AI719689 | cDNA clone IMAGE:2332886 | colon | 3' read | |||
| AW084605 | cDNA clone IMAGE:2569725 | five pooled sarcomas, including myxoid liposarcoma, solitary | 3' read | |||
| AA070161 | cDNA clone IMAGE:530913 | 3' read | ||||
| R43995 | cDNA clone IMAGE:33432 | brain | 3' read | 1.8 kb | ||
| F37348 | cDNA clone sH5000025-0/D12 | muscle | ||||
| BE777833 | cDNA clone IMAGE:3866684 | retinoblastoma | 5' read | |||
| F27478 | cDNA clone s4000071B08 | muscle | ||||
| BE270970 | cDNA clone IMAGE:2966610 | burkitt lymphoma | 3' read | |||
| BE271146 | cDNA clone IMAGE:2966484 | burkitt lymphoma | 3' read | |||
| BG744794 | cDNA clone IMAGE:4849396 | natural killer cells, cell line | 3' read | |||
| BG683926 | cDNA clone IMAGE:4761720 | neuroblastoma, cell line | 3' read |