
| Candidate UniGene cluster: | UniGene Cluster Hs.44104 |
| Description: | Homo sapiens cDNA FLJ31377 fis, clone NESOP1000087 |
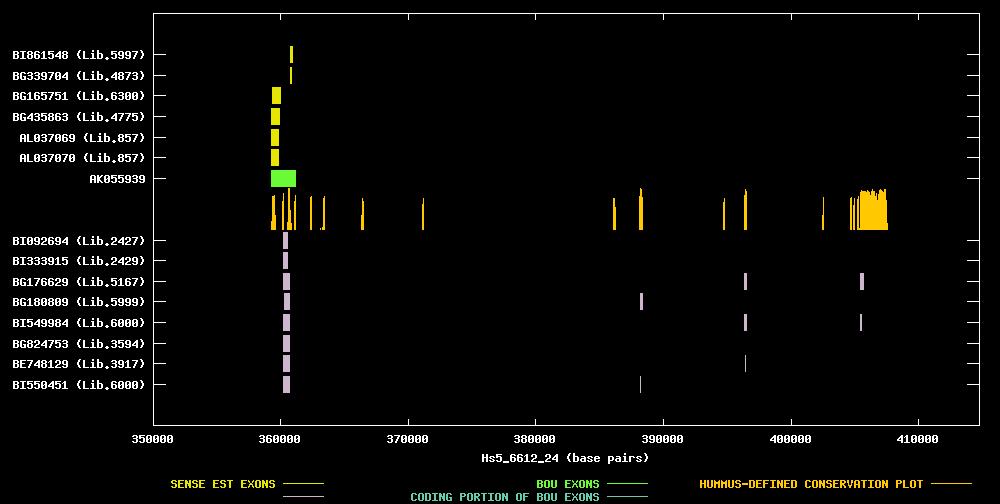
| Best-Of-UniGene (BOU) Sequence | AK055939 |
| Genomic Coordiantes Displayed: | Bases 350030 to 414762 of contig Hs5_6612_24 |
| BOU Orientation Along Contig: | RIGHT-TO-LEFT with respect to contig |
| Link to JPEG of genomic mapping | Hs.44104.jpeg |
| Best sense EST/protein match: | No protein match with an e-value of less than 1e-10 |
| Best antisense EST/protein match: | BI549984 matched ref|NP_071413.1| (NM_022130) golgi phosphoprotein 3 (coat-protein); Golgi protein; (E = 2e-23) |
ANTISENSE ESTs
| BI092694 | cDNA clone IMAGE:4999629 | placenta | 5' read | |||
| BI333915 | cDNA clone IMAGE:5141486 | choriocarcinoma | 5' read | | ||
| BG176629 | cDNA clone IMAGE:4419053 | lymphoma, cell line | 5' read | | ||
| BG180809 | cDNA clone IMAGE:4428707 | adenocarcinoma, cell line | 5' read | | ||
| BI549984 | cDNA clone IMAGE:5264097 | hippocampus, cell line | 5' read | | ||
| BG824753 | cDNA clone IMAGE:4867882 | adenocarcinoma cell line | 5' read | |||
| BE748129 | cDNA clone IMAGE:3838581 | from acute myelogenous leukemia | 5' read | |||
| BI550451 | cDNA clone IMAGE:5264286 | hippocampus, cell line | 5' read | |
| AL037070 | cDNA clone DKFZp564K1164 | brain | 3' read | |||
| AL037069 | cDNA clone DKFZp564K1164 | brain | 5' read | |||
| BG435863 | cDNA clone IMAGE:4605932 | placenta | 5' read | |||
| BG165751 | cDNA clone IMAGE:4454353 | hypernephroma, cell line | 5' read | |||
| BG339704 | cDNA clone IMAGE:4555029 | leiomyosarcoma cell line | 5' read | |||
| BI861548 | cDNA clone IMAGE:5399497 | mammary adenocarcinoma, cell line | 5' read |