
| Candidate UniGene cluster: | UniGene Cluster Hs.47144 |
| Description: | DKFZP586N0819 protein |
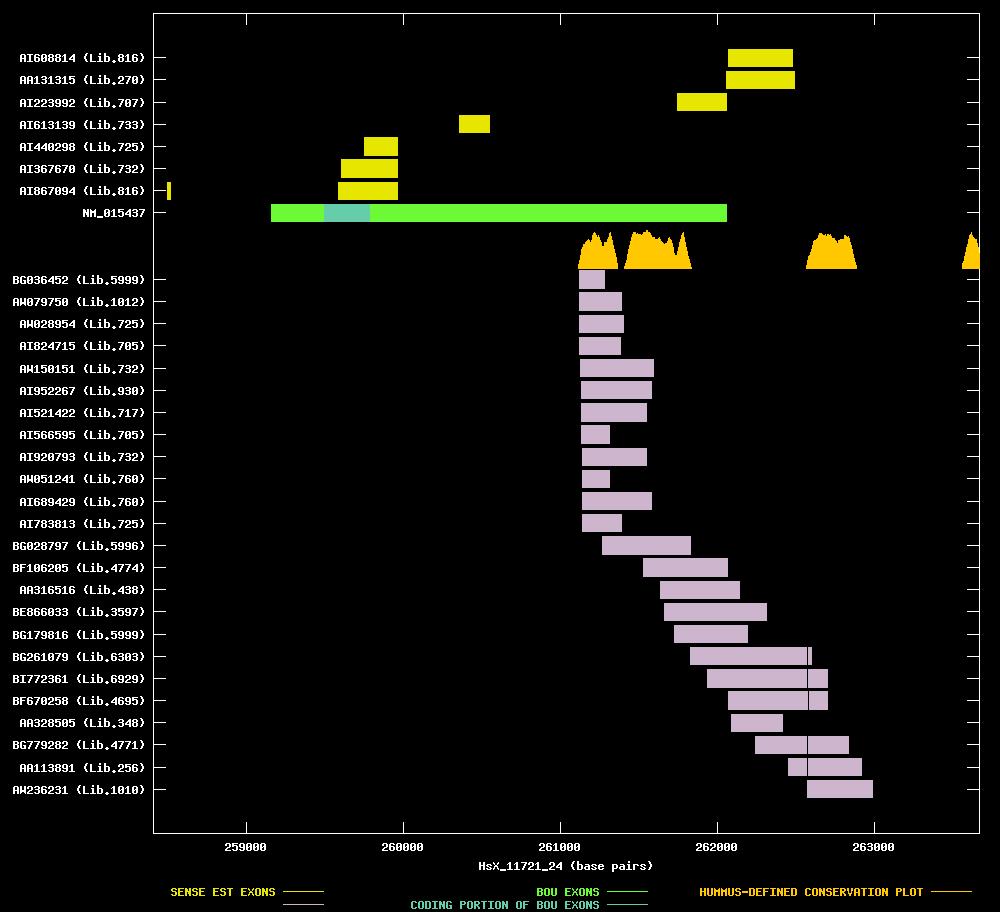
| Best-Of-UniGene (BOU) Sequence | NM_015437 |
| Genomic Coordiantes Displayed: | Bases 258410 to 263671 of contig HsX_11721_24 |
| BOU Orientation Along Contig: | LEFT-TO-RIGHT with respect to contig |
| Link to JPEG of genomic mapping | Hs.47144.jpeg |
| Best sense EST/protein match: | NM_015437 matched ref|NP_056252.1| (NM_015437) DKFZP586N0819 protein [Homo sapiens] (E = 1e-49) |
| Best antisense EST/protein match: | No protein match with an e-value of less than 1e-10 |
ANTISENSE ESTs
| BG036452 | cDNA clone IMAGE:4428023 | adenocarcinoma, cell line | 5' read | | ||
| AW079750 | cDNA clone IMAGE:2585414 | moderately differentiated adenocarcinoma | 3' read | | ||
| AW028954 | cDNA clone IMAGE:2542048 | stomach | 3' read | 2.6 kb | | |
| AI824715 | cDNA clone IMAGE:2322720 | pancreas | 3' read | 2.5 kb | | |
| AW150151 | cDNA clone IMAGE:2629618 | uterus | 3' read | | ||
| AI952267 | cDNA clone IMAGE:2547093 | two pooled squamous cell carcinomas | 3' read | 1.5 kb | | |
| AI521422 | cDNA clone IMAGE:2122671 | ovary | 3' read | 0.7 kb | | |
| AI566595 | cDNA clone IMAGE:2224306 | pancreas | 3' read | 0.9 kb | | |
| AI920793 | cDNA clone IMAGE:2452301 | uterus | 3' read | 1.5 kb | | |
| AW051241 | cDNA clone IMAGE:2557648 | uterus | 3' read | | ||
| AI689429 | cDNA clone IMAGE:2276227 | uterus | 3' read | 2.3 kb | | |
| AI783813 | cDNA clone IMAGE:2257251 | stomach | 3' read | | ||
| BG028797 | cDNA clone IMAGE:4387873 | osteosarcoma, cell line | 5' read | |||
| BF106205 | cDNA clone IMAGE:4043229 | lung | 5' read | |||
| AA316516 | cDNA clone ATCC:112997 | 5' read |