
| Candidate UniGene cluster: | UniGene Cluster Hs.5400 |
| Description: | KIAA1018 protein |
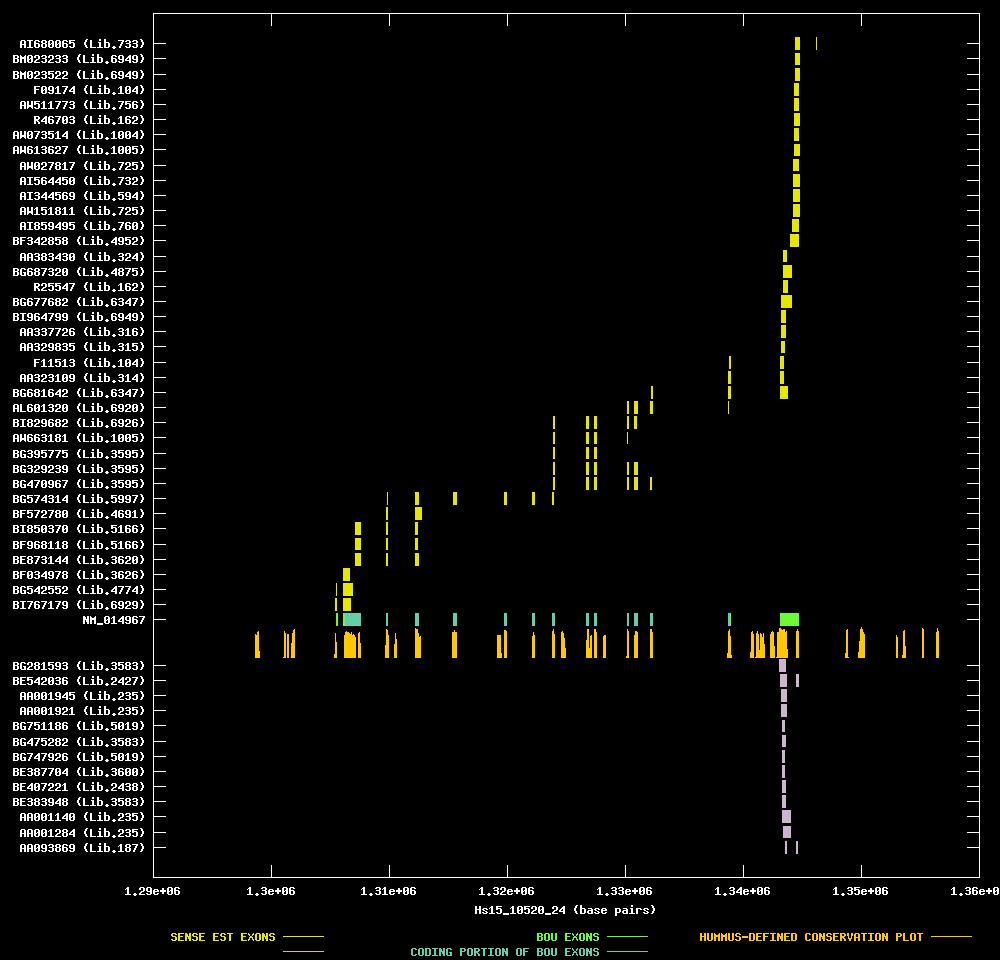
| Best-Of-UniGene (BOU) Sequence | NM_014967 |
| Genomic Coordiantes Displayed: | Bases 1290000 to 1360000 of contig Hs15_10520_24 |
| BOU Orientation Along Contig: | LEFT-TO-RIGHT with respect to contig |
| Link to JPEG of genomic mapping | Hs.5400.jpeg |
| Best sense EST/protein match: | BE873144 matched ref|XP_007768.3| (XM_007768) KIAA1018 protein [Homo sapiens] (E = e-100) |
| Best antisense EST/protein match: | AA001921 matched ref|XP_058715.1| (XM_058715) similar to KIAA1682 protein (H. sapiens) [Homo sapiens] (E = 2e-46) |
ANTISENSE ESTs
| BG281593 | cDNA clone IMAGE:4544843 | melanotic melanoma | 5' read | |||
| BE542036 | cDNA clone IMAGE:3453346 | placenta | 5' read | |||
| AA001945 | cDNA clone IMAGE:427882 | pool | 3' read | 0.8 kb | | |
| AA001921 | cDNA clone IMAGE:427906 | pool | 3' read | 0.8 kb | | |
| BG751186 | cDNA clone IMAGE:4873532 | normal pigmented retinal epithelium | 5' read | |||
| BG475282 | cDNA clone IMAGE:4620465 | melanotic melanoma | 5' read | |||
| BG747926 | cDNA clone IMAGE:4842450 | normal pigmented retinal epithelium | 5' read | |||
| BE387704 | cDNA clone IMAGE:3621566 | endometrium, adenocarcinoma cell line | 5' read | |||
| BE407221 | cDNA clone IMAGE:3635720 | choriocarcinoma | 5' read | | ||
| BE383948 | cDNA clone IMAGE:3614256 | melanotic melanoma | 5' read | | ||
| AA001140 | cDNA clone IMAGE:427882 | pool | 5' read | 0.8 kb | ||
| AA001284 | cDNA clone IMAGE:427906 | pool | 5' read | 0.8 kb | ||
| AA093869 | cDNA clone (no-name) | heart | 5' read |
| BI767179 | cDNA clone IMAGE:5209981 | pooled lung and spleen | 5' read | |||
| BG542552 | cDNA clone IMAGE:4696285 | lung | 5' read | |||
| BF034978 | cDNA clone IMAGE:3862786 | adenocarcinoma | 5' read | |||
| BE873144 | cDNA clone IMAGE:3855565 | adenocarcinoma | 5' read | | ||
| BF968118 | cDNA clone IMAGE:4357462 | adrenal cortex carcinoma, cell line | 5' read | |||
| BI850370 | cDNA clone IMAGE:4357462 | adrenal cortex carcinoma, cell line | 5' read | | ||
| BF572780 | cDNA clone IMAGE:4243757 | melanotic melanoma, high mdr | 5' read | |||
| BG574314 | cDNA clone IMAGE:4705374 | mammary adenocarcinoma, cell line | 5' read | |||
| BG470967 | cDNA clone IMAGE:4634411 | retinoblastoma | 5' read | | ||
| BG329239 | cDNA clone IMAGE:4558057 | retinoblastoma | 5' read | |||
| BG395775 | cDNA clone IMAGE:4581130 | retinoblastoma | 5' read | |||
| AW663181 | cDNA clone IMAGE:2968643 | 2 pooled high-grade transitional cell tumors | 5' read | | ||
| BI829682 | cDNA clone IMAGE:5171575 | medulla | 5' read | | ||
| AL601320 | cDNA clone DKFZp313O1440 | 5' read | | |||
| BG681642 | cDNA clone IMAGE:4752899 | squamous cell carcinoma | 5' read | | ||
| AA323109 | cDNA clone ATCC:123637 | brain | 5' read | | ||
| F11513 | cDNA clone c2ya01 | brain | ||||
| AA329835 | cDNA clone ATCC:131494 | whole embryo | 5' read | |||
| AA337726 | cDNA clone ATCC:139640 | uterus | 5' read | | ||
| BI964799 | cDNA clone (no-name) | islets of langerhans | 5' read | |||
| BG677682 | cDNA clone IMAGE:4750186 | squamous cell carcinoma | 5' read | |||
| R25547 | cDNA clone IMAGE:36597 | brain | 5' read | 2.4 kb | | |
| BG687320 | cDNA clone IMAGE:4762768 | mucoepidermoid carcinoma | 5' read | |||
| AA383430 | cDNA clone ATCC:187764 | testis | 5' read | |||
| BF342858 | cDNA clone IMAGE:4150714 | glioblastoma with egfr amplification | 5' read |  | ||
| AI859495 | cDNA clone IMAGE:2435752 | uterus | 3' read | 0.7 kb | | |
| AW151811 | cDNA clone IMAGE:2623343 | stomach | 3' read | | ||
| AI344569 | cDNA clone IMAGE:1917486 | kidney | 3' read | 1.2 kb | | |
| AI564450 | cDNA clone IMAGE:2212915 | uterus | 3' read | | ||
| AW027817 | cDNA clone IMAGE:2533962 | stomach | 3' read | | ||
| AW613627 | cDNA clone IMAGE:2968643 | 2 pooled high-grade transitional cell tumors | 3' read | | ||
| AW073514 | cDNA clone IMAGE:2568932 | five pooled sarcomas, including myxoid liposarcoma, solitary | 3' read | | ||
| R46703 | cDNA clone IMAGE:36597 | brain | 3' read | 2.4 kb | | |
| AW511773 | cDNA clone IMAGE:2807672 | kidney | 3' read | | ||
| F09174 | cDNA clone c2ya01 | brain | 3' read | |||
| BM023522 | cDNA clone (no-name) | islets of langerhans | 5' read | | ||
| BM023233 | cDNA clone (no-name) | islets of langerhans | 3' read | | ||
| AI680065 | cDNA clone IMAGE:2264483 | uterus | 3' read | 1.9 kb | |