

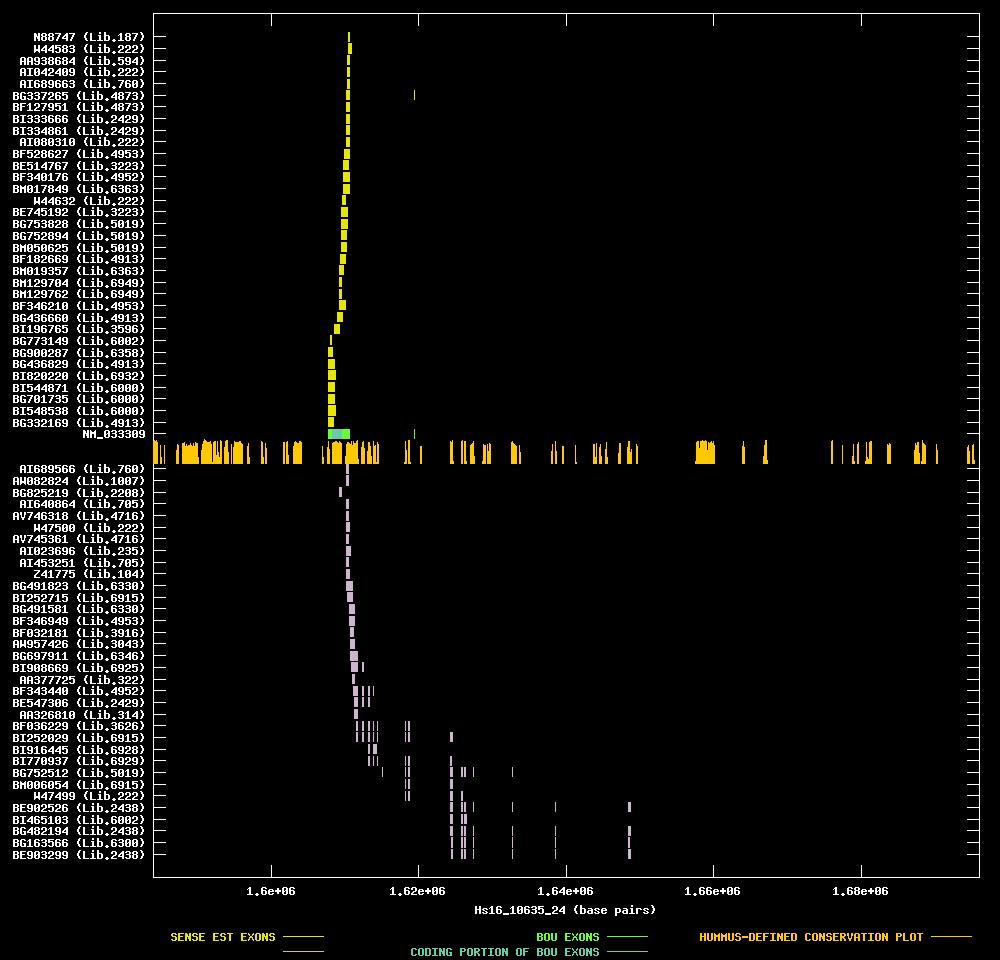
| Candidate UniGene cluster: | UniGene Cluster Hs.55923 |
| Description: | hypothetical protein MGC4655 |
| Best-Of-UniGene (BOU) Sequence | NM_033309 |
| Genomic Coordiantes Displayed: | Bases 1584000 to 1696000 of contig Hs16_10635_24 |
| BOU Orientation Along Contig: | LEFT-TO-RIGHT with respect to contig |
| Link to JPEG of genomic mapping | Hs.55923.jpeg |
| Best sense EST/protein match: | BI196765 matched ref|NP_171608.1| (NM_033309) hypothetical protein MGC4655 [Homo sapiens] (E = e-119) |
| Best antisense EST/protein match: | BG482194 matched gb|AAH04556.1|AAH04556 (BC004556) Similar to CG7083 gene product [Homo sapiens] (E = e-109) |
ANTISENSE ESTs
| AI689566 | cDNA clone IMAGE:2276265 | uterus | 3' read | 1.6 kb | | |
| AW082824 | cDNA clone IMAGE:2583194 | moderately differentiated adenocarcinoma | 3' read | |||
| BG825219 | cDNA clone IMAGE:4900496 | rhabdomyosarcoma | 5' read | |||
| AI640864 | cDNA clone IMAGE:2293844 | pancreas | 3' read | | ||
| AV746318 | cDNA clone NPAAMF09 | pituitary | 5' read | |||
| W47500 | cDNA clone IMAGE:324211 | 3' read | 2.6 kb | |||
| AV745361 | cDNA clone NPAAAB02 | pituitary | 5' read | |||
| AI023696 | cDNA clone IMAGE:1654211 | pool | 3' read | 0.6 kb | | |
| AI453251 | cDNA clone IMAGE:2143947 | pancreas | 3' read | 2.4 kb | | |
| Z41775 | cDNA clone c1cb03 | brain | 3' read | | ||
| BG491823 | cDNA clone IMAGE:4684944 | amelanotic melanoma, cell line | 3' read | |||
| BI252715 | cDNA clone IMAGE:5086911 | hepatocellular carcinoma, cell line | 3' read | |||
| BG491581 | cDNA clone IMAGE:4684944 | amelanotic melanoma, cell line | 5' read | |||
| BF346949 | cDNA clone IMAGE:4157231 | anaplastic oligodendroglioma with 1p/19q loss | 5' read | |||
| BF032181 | cDNA clone IMAGE:3828528 | hypernephroma | 5' read | | ||
| AW957426 | cDNA clone (no-name) | |||||
| BG697911 | cDNA clone IMAGE:4804234 | skin | 5' read | |||
| BI908669 | cDNA clone IMAGE:5216014 | leukocyte | 5' read | | ||
| AA377725 | cDNA clone ATCC:182123 | synovial membrane | 5' read | |||
| BF343440 | cDNA clone IMAGE:4150405 | glioblastoma with egfr amplification | 5' read | | ||
| BE547306 | cDNA clone IMAGE:3459872 | choriocarcinoma | 5' read | | ||
| AA326810 | cDNA clone ATCC:127476 | brain | 5' read | | ||
| BF036229 | cDNA clone IMAGE:3862564 | adenocarcinoma | 5' read | | ||
| BI252029 | cDNA clone IMAGE:5086939 | hepatocellular carcinoma, cell line | 5' read | | ||
| BI916445 | cDNA clone IMAGE:5246473 | brain | 5' read |