
| Candidate UniGene cluster: | UniGene Cluster Hs.58679 |
| Description: | solute carrier family 7, (cationic amino acid transporter, y+ system) member 10 |
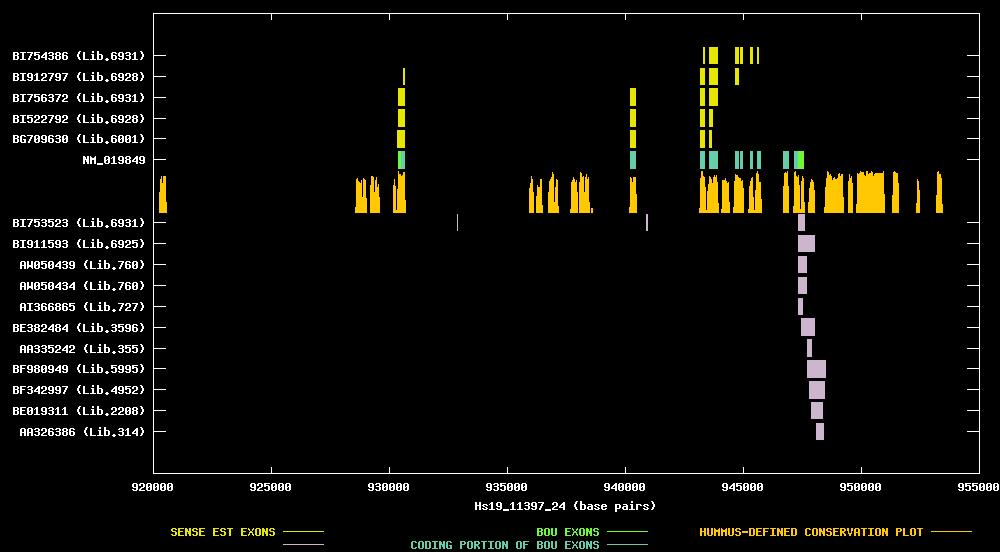
| Best-Of-UniGene (BOU) Sequence | NM_019849 |
| Genomic Coordiantes Displayed: | Bases 920000 to 955000 of contig Hs19_11397_24 |
| BOU Orientation Along Contig: | LEFT-TO-RIGHT with respect to contig |
| Link to JPEG of genomic mapping | Hs.58679.jpeg |
| Best sense EST/protein match: | BI754386 matched ref|NP_062823.1| (NM_019849) solute carrier family 7, member 10; asc-type amino acid (E = e-132) |
| Best antisense EST/protein match: | No protein match with an e-value of less than 1e-10 |
ANTISENSE ESTs
| BI753523 | cDNA clone IMAGE:5197145 | brain | 5' read | |||
| BI911593 | cDNA clone IMAGE:5213155 | leukocyte | 5' read | |||
| AW050439 | cDNA clone IMAGE:2557787 | uterus | 3' read | 0.7 kb | | |
| AW050434 | cDNA clone IMAGE:2557786 | uterus | 3' read | 0.7 kb | | |
| AI366865 | cDNA clone IMAGE:1989206 | uterus | 3' read | 0.3 kb | | |
| BE382484 | cDNA clone IMAGE:3627592 | neuroblastoma | 5' read | |||
| AA335242 | cDNA clone ATCC:136922 | testis | 5' read | |||
| BF980949 | cDNA clone IMAGE:4401576 | duodenal adenocarcinoma, cell line | 5' read | |||
| BF342997 | cDNA clone IMAGE:4152768 | glioblastoma with egfr amplification | 5' read | |||
| BE019311 | cDNA clone IMAGE:3010509 | rhabdomyosarcoma | 5' read | |||
| AA326386 | cDNA clone ATCC:126916 | brain | 5' read |
| BG709630 | cDNA clone IMAGE:4796275 | hypothalamus, cell line | 5' read |  | ||
| BI522792 | cDNA clone IMAGE:5240227 | brain | 5' read | | ||
| BI756372 | cDNA clone IMAGE:5200601 | brain | 5' read | | ||
| BI912797 | cDNA clone IMAGE:5240697 | brain | 5' read | | ||
| BI754386 | cDNA clone IMAGE:5197476 | brain | 5' read | |