
| Candidate UniGene cluster: | UniGene Cluster Hs.64639 |
| Description: | glioma pathogenesis-related protein |
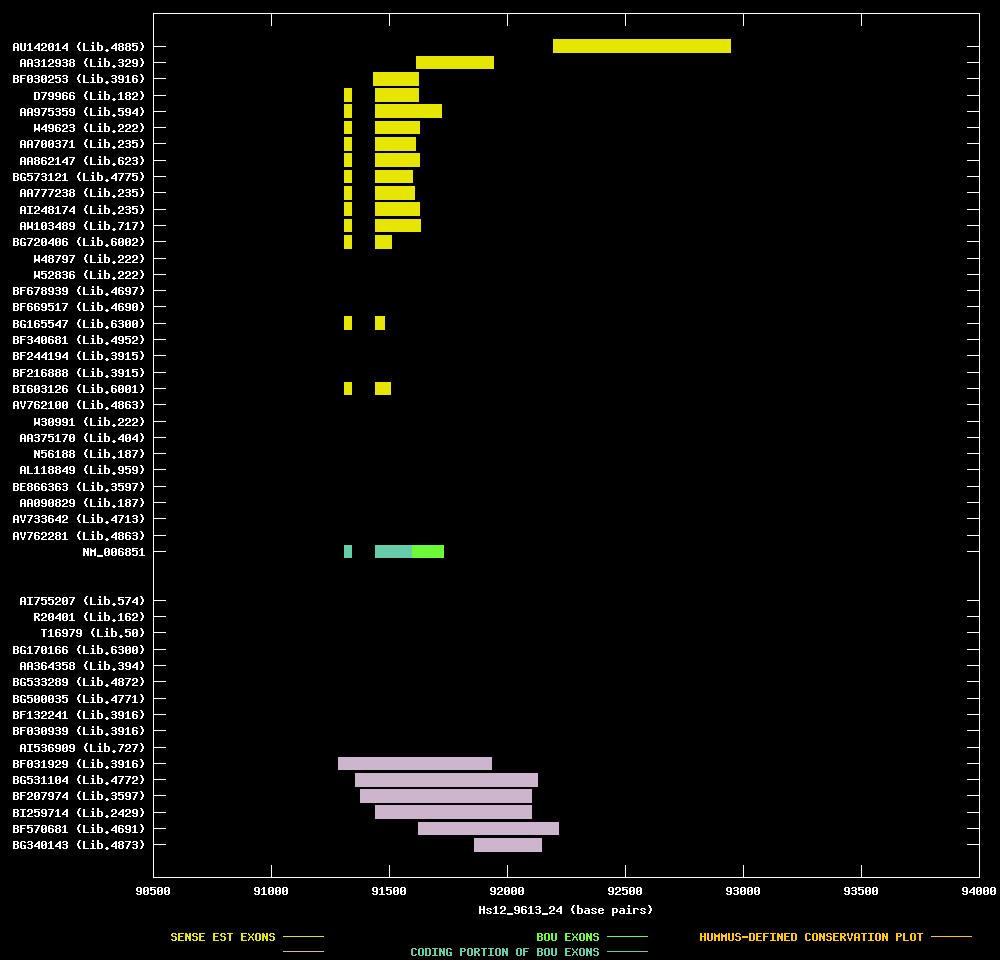
| Best-Of-UniGene (BOU) Sequence | NM_006851 |
| Genomic Coordiantes Displayed: | Bases 90500 to 94000 of contig Hs12_9613_24 |
| BOU Orientation Along Contig: | LEFT-TO-RIGHT with respect to contig |
| Link to JPEG of genomic mapping | Hs.64639.jpeg |
| Best sense EST/protein match: | BF678939 matched ref|NP_006842.1| (NM_006851) glioma pathogenesis-related protein [Homo sapiens] (E = e-100) |
| Best antisense EST/protein match: | No protein match with an e-value of less than 1e-10 |
ANTISENSE ESTs
| AI755207 | cDNA clone HBMSC_cr36h12 | bone | 3' read | | ||
| R20401 | cDNA clone IMAGE:32775 | brain | 5' read | 2.1 kb | ||
| T16979 | cDNA clone NIB20965R | brain | 5' read | |||
| BG170166 | cDNA clone IMAGE:4424900 | hypernephroma, cell line | 5' read | |||
| AA364358 | cDNA clone ATCC:169296 | brain | 5' read | |||
| BG533289 | cDNA clone IMAGE:4072022 | liver | 5' read | | ||
| BG500035 | cDNA clone IMAGE:4668512 | adenocarcinoma | 5' read | |||
| BF132241 | cDNA clone IMAGE:4052067 | hypernephroma | 5' read | |||
| BF030939 | cDNA clone IMAGE:3828614 | hypernephroma | 5' read | |||
| AI536909 | cDNA clone IMAGE:2178987 | uterus | 3' read | 1.0 kb | ||
| BF031929 | cDNA clone IMAGE:3829187 | hypernephroma | 5' read | | ||
| BG531104 | cDNA clone IMAGE:4699274 | embryonal carcinoma | 5' read | |||
| BF207974 | cDNA clone IMAGE:4082039 | carcinoma, cell line | 5' read | | ||
| BI259714 | cDNA clone IMAGE:5110809 | choriocarcinoma | 5' read | | ||
| BF570681 | cDNA clone IMAGE:4242975 | melanotic melanoma, high mdr | 5' read | |||
| BG340143 | cDNA clone IMAGE:4555398 | leiomyosarcoma cell line | 5' read |
| AV762281 | cDNA clone MDSCHC10 | bone marrow | 5' read | | ||
| AV733642 | cDNA clone cdABAF02 | pheochromocytoma | 5' read | | ||
| AA090829 | cDNA clone (no-name) | heart | 5' read | |||
| BE866363 | cDNA clone IMAGE:3961868 | carcinoma, cell line | 5' read | | ||
| AL118849 | cDNA clone DKFZp761J2111 | amygdala | 5' read | | ||
| N56188 | cDNA clone J8419 | heart | 5' read | | ||
| AA375170 | cDNA clone ATCC:179585 | 5' read | ||||
| W30991 | cDNA clone IMAGE:310347 | 5' read | 1.7 kb | | ||
| AV762100 | cDNA clone MDSEOA02 | bone marrow | 5' read | | ||
| BI603126 | cDNA clone IMAGE:5303847 | hypothalamus, cell line | 5' read | | ||
| BF216888 | cDNA clone IMAGE:4095753 | glioblastoma | 5' read | | ||
| BF244194 | cDNA clone IMAGE:4080705 | glioblastoma | 5' read | | ||
| BF340681 | cDNA clone IMAGE:4183401 | glioblastoma with egfr amplification | 5' read | | ||
| BG165547 | cDNA clone IMAGE:4453841 | hypernephroma, cell line | 5' read | | ||
| BF669517 | cDNA clone IMAGE:4277407 | primitive neuroectoderm | 5' read | | ||
| BF678939 | cDNA clone IMAGE:4294648 | prostate | 5' read | | ||
| W52836 | cDNA clone IMAGE:326246 | 5' read | 1.0 kb | | ||
| W48797 | cDNA clone IMAGE:325190 | 5' read | | |||
| BG720406 | cDNA clone IMAGE:4823904 | testis, cell line | 5' read | | ||
| AW103489 | cDNA clone IMAGE:2595924 | ovary | 3' read | | ||
| AI248174 | cDNA clone IMAGE:1849468 | pool | 3' read | 0.8 kb | | |
| AA777238 | cDNA clone IMAGE:448219 | pool | 3' read | | ||
| BG573121 | cDNA clone IMAGE:4721476 | placenta | 5' read | | ||
| AA862147 | cDNA clone IMAGE:1485914 | head and neck | 3' read | 1.0 kb |  | |
| AA700371 | cDNA clone IMAGE:460495 | pool | 3' read | | ||
| W49623 | cDNA clone IMAGE:325190 | 3' read | | |||
| AA975359 | cDNA clone IMAGE:1588689 | kidney | 3' read | 1.2 kb | | |
| D79966 | cDNA clone GEN365E04 | aorta | 5' read | | ||
| BF030253 | cDNA clone IMAGE:3828278 | hypernephroma | 5' read | | ||
| AA312938 | cDNA clone ATCC:167791 | bone | 5' read | |||
| AU142014 | cDNA clone THYRO1001615 | thyroid gland | 5' read |