
| Candidate UniGene cluster: | UniGene Cluster Hs.65029 |
| Description: | growth arrest-specific 1 |
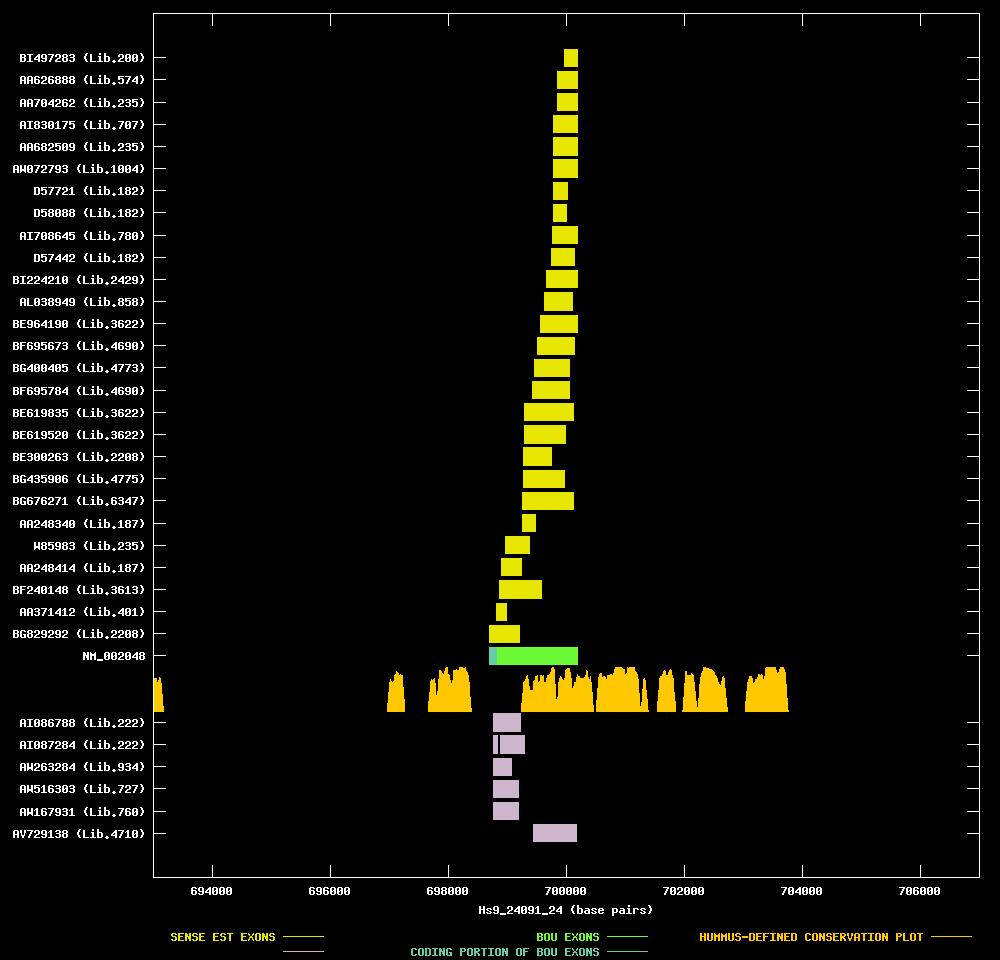
| Best-Of-UniGene (BOU) Sequence | NM_002048 |
| Genomic Coordiantes Displayed: | Bases 693000 to 707000 of contig Hs9_24091_24 |
| BOU Orientation Along Contig: | LEFT-TO-RIGHT with respect to contig |
| Link to JPEG of genomic mapping | Hs.65029.jpeg |
| Best sense EST/protein match: | NM_002048 matched ref|NP_002039.1| (NM_002048) growth arrest-specific 1; Growth arrest-specific gene-1 (E = e-119) |
| Best antisense EST/protein match: | AI087284 matched ref|XP_072546.1| (XM_072546) hypothetical protein XP_072546 [Homo sapiens] (E = 7e-56) |
ANTISENSE ESTs
| AI086788 | cDNA clone IMAGE:1681356 | 3' read | 0.7 kb | |||
| AI087284 | cDNA clone IMAGE:1681387 | 3' read | 0.8 kb | |||
| AW263284 | cDNA clone IMAGE:2757604 | three pooled meningiomas | 3' read | | ||
| AW516303 | cDNA clone IMAGE:2791236 | uterus | 3' read | | ||
| AW167931 | cDNA clone IMAGE:2632424 | uterus | 3' read | |||
| AV729138 | cDNA clone HTCBJF05 | hypothalamus | 5' read |
| BG829292 | cDNA clone IMAGE:4905862 | rhabdomyosarcoma | 5' read | | ||
| AA371412 | cDNA clone ATCC:175832 | prostate | 5' read | |||
| BF240148 | cDNA clone IMAGE:4133485 | from chronic myelogenous leukemia | 5' read | |||
| AA248414 | cDNA clone (no-name) | heart | 5' read | |||
| W85983 | cDNA clone IMAGE:416122 | pool | 5' read | 1.3 kb | ||
| AA248340 | cDNA clone (no-name) | heart | 5' read | |||
| BG676271 | cDNA clone IMAGE:4747960 | squamous cell carcinoma | 5' read | |||
| BG435906 | cDNA clone IMAGE:4605231 | placenta | 5' read | |||
| BE300263 | cDNA clone IMAGE:2960380 | rhabdomyosarcoma | 3' read | |||
| BE619520 | cDNA clone IMAGE:3876138 | large cell carcinoma | 5' read | |||
| BE619835 | cDNA clone IMAGE:3876138 | large cell carcinoma | 3' read |  | ||
| BF695784 | cDNA clone IMAGE:4076191 | primitive neuroectoderm | 5' read | |||
| BG400405 | cDNA clone IMAGE:4592526 | kidney | 5' read | |||
| BF695673 | cDNA clone IMAGE:4076113 | primitive neuroectoderm | 5' read |