
| Candidate UniGene cluster: | UniGene Cluster Hs.82547 |
| Description: | retinoic acid receptor responder (tazarotene induced) 1 |
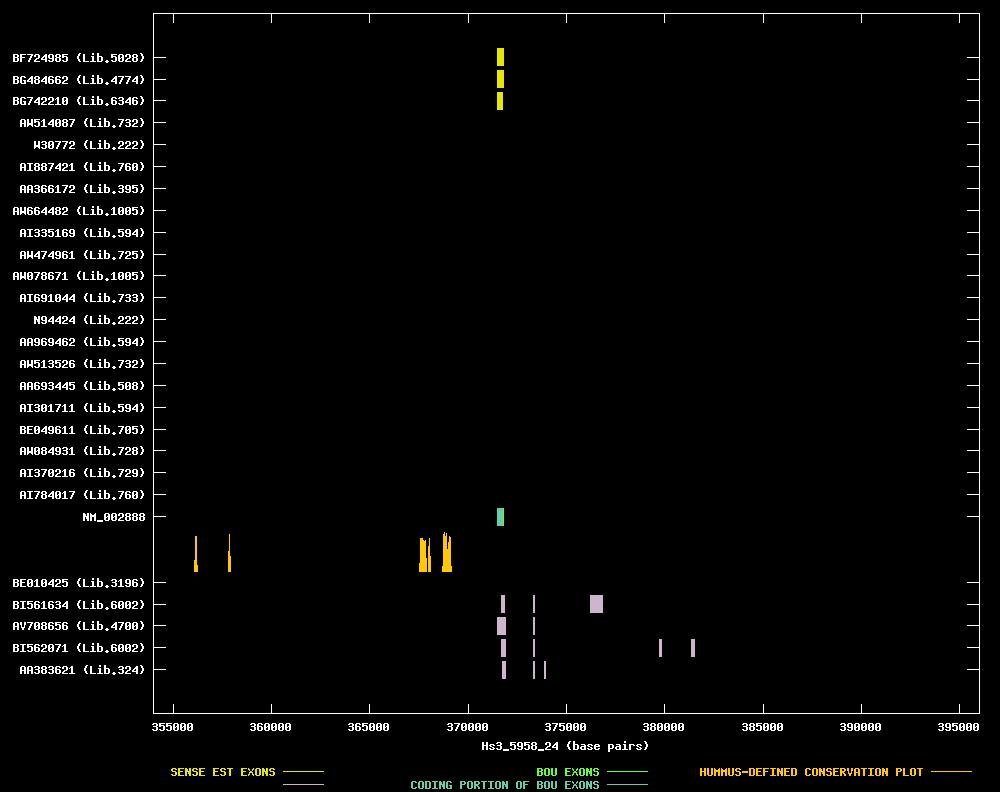
| Best-Of-UniGene (BOU) Sequence | NM_002888 |
| Genomic Coordiantes Displayed: | Bases 354000 to 396000 of contig Hs3_5958_24 |
| BOU Orientation Along Contig: | RIGHT-TO-LEFT with respect to contig |
| Link to JPEG of genomic mapping | Hs.82547.jpeg |
| Best sense EST/protein match: | NM_002888 matched ref|NP_002879.1| (NM_002888) retinoic acid receptor responder (tazarotene induced) 1 (E = e-101) |
| Best antisense EST/protein match: | No protein match with an e-value of less than 1e-10 |
ANTISENSE ESTs
| BE010425 | cDNA clone (no-name) | breast_normal | ||||
| BI561634 | cDNA clone IMAGE:5298324 | testis, cell line | 5' read | |||
| AV708656 | cDNA clone ADCADA01 | adrenal gland | 5' read | | ||
| BI562071 | cDNA clone IMAGE:5299017 | testis, cell line | 5' read | | ||
| AA383621 | cDNA clone ATCC:187793 | testis | 5' read |
| AI784017 | cDNA clone IMAGE:2180444 | uterus | 3' read | 0.6 kb |  | |
| AI370216 | cDNA clone IMAGE:1967651 | lymph | 3' read | 1.3 kb | ||
| AW084931 | cDNA clone IMAGE:2589172 | esophagus | 3' read | | ||
| BE049611 | cDNA clone IMAGE:2835366 | pancreas | 3' read | | ||
| AI301711 | cDNA clone IMAGE:1900385 | kidney | 3' read | 1.9 kb | ||
| AA693445 | cDNA clone IMAGE:1157177 | kidney | 3' read | | ||
| AW513526 | cDNA clone IMAGE:2707063 | uterus | 3' read | | ||
| AA969462 | cDNA clone IMAGE:1572590 | kidney | 3' read | 1.8 kb | | |
| N94424 | cDNA clone IMAGE:309583 | 3' read | 1.2 kb | |||
| AI691044 | cDNA clone IMAGE:2208729 | uterus | 3' read | 1.6 kb | | |
| AW078671 | cDNA clone IMAGE:2575155 | 2 pooled high-grade transitional cell tumors | 3' read | | ||
| AW474961 | cDNA clone IMAGE:2881960 | stomach | 3' read | | ||
| AI335169 | cDNA clone IMAGE:1915332 | kidney | 3' read | 3.1 kb | ||
| AW664482 | cDNA clone IMAGE:2972128 | 2 pooled high-grade transitional cell tumors | 3' read | | ||
| AA366172 | cDNA clone ATCC:170980 | pancreas | 5' read | | ||
| AI887421 | cDNA clone IMAGE:2435040 | uterus | 3' read | 0.9 kb | | |
| W30772 | cDNA clone IMAGE:309583 | 5' read | 1.2 kb | | ||
| AW514087 | cDNA clone IMAGE:2792817 | uterus | 3' read | | ||
| BG742210 | cDNA clone IMAGE:4776506 | skin | 5' read | | ||
| BG484662 | cDNA clone IMAGE:4619385 | lung | 5' read | |