

| Candidate UniGene cluster: | UniGene Cluster Hs.93121 |
| Description: | Mid-1-related chloride channel 1 |
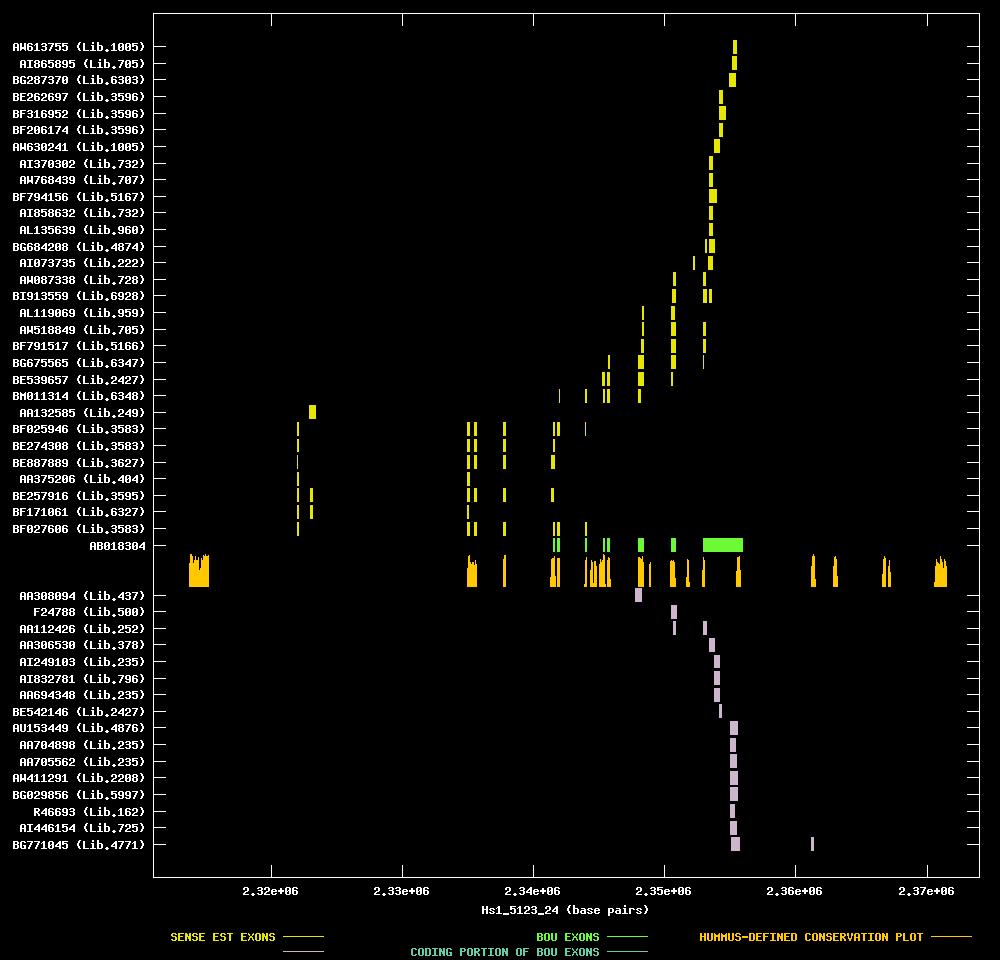
| Best-Of-UniGene (BOU) Sequence | AB018304 |
| Genomic Coordiantes Displayed: | Bases 2311000 to 2374000 of contig Hs1_5123_24 |
| BOU Orientation Along Contig: | LEFT-TO-RIGHT with respect to contig |
| Link to JPEG of genomic mapping | Hs.93121.jpeg |
| Best sense EST/protein match: | BF025946 matched ref|NP_055942.1| (NM_015127) KIAA0761 protein [Homo sapiens] (E = 2e-86) |
| Best antisense EST/protein match: | BG771045 matched ref|NP_037428.1| (NM_013296) LGN protein [Homo sapiens] (E = 1e-59) |
ANTISENSE ESTs
| AA308094 | cDNA clone ATCC:111893 | 5' read | | |||
| F24788 | cDNA clone s4000019F05 | muscle | | |||
| AA112426 | cDNA clone IMAGE:526863 | 5' read | | |||
| AA306530 | cDNA clone ATCC:160647 | 5' read | ||||
| AI249103 | cDNA clone IMAGE:1850359 | pool | 3' read | 0.4 kb | ||
| AI832781 | cDNA clone IMAGE:2377522 | colon | 3' read | |||
| AA694348 | cDNA clone IMAGE:433966 | pool | 3' read | |||
| BE542146 | cDNA clone IMAGE:3452728 | placenta | 5' read | |||
| AU153449 | cDNA clone NT2RP3003213 | 3' read | | |||
| AA704898 | cDNA clone IMAGE:461362 | pool | 3' read | |||
| AA705562 | cDNA clone IMAGE:462398 | pool | 3' read | |||
| AW411291 | cDNA clone IMAGE:2964550 | rhabdomyosarcoma | 3' read | | ||
| BG029856 | cDNA clone IMAGE:4390990 | mammary adenocarcinoma, cell line | 5' read | |||
| R46693 | cDNA clone IMAGE:36381 | brain | 3' read | 1.2 kb | ||
| AI446154 | cDNA clone IMAGE:2140831 | stomach | 3' read | 1.1 kb | ||
| BG771045 | cDNA clone IMAGE:4839792 | adenocarcinoma | 5' read | |
| BF027606 | cDNA clone IMAGE:3953674 | melanotic melanoma | 5' read | |||
| BF171061 | cDNA clone (no-name) | blood | ||||
| BE257916 | cDNA clone IMAGE:3350505 | retinoblastoma | 5' read | |||
| AA375206 | cDNA clone ATCC:179686 | 5' read | | |||
| BE887889 | cDNA clone IMAGE:3912691 | leiomyosarcoma | 5' read | |||
| BE274308 | cDNA clone IMAGE:2967383 | melanotic melanoma | 5' read | |||
| BF025946 | cDNA clone IMAGE:3952785 | melanotic melanoma | 5' read | |||
| AA132585 | cDNA clone IMAGE:587430 | 5' read | 1.7 kb | |||
| BM011314 | cDNA clone IMAGE:5457837 | neuroblastoma, cell line | 5' read | |||
| BE539657 | cDNA clone IMAGE:3446101 | placenta | 5' read | | ||
| BG675565 | cDNA clone IMAGE:4746928 | squamous cell carcinoma | 5' read | |||
| BF791517 | cDNA clone IMAGE:4343779 | adrenal cortex carcinoma, cell line | 5' read | |||
| AW518849 | cDNA clone IMAGE:2876614 | pancreas | 3' read | | ||
| AL119069 | cDNA clone DKFZp761C0112 | amygdala | 5' read | |||
| BI913559 | cDNA clone IMAGE:5244290 | brain | 5' read | | ||
| AW087338 | cDNA clone IMAGE:2579522 | esophagus | 3' read | | ||
| AI073735 | cDNA clone IMAGE:1664903 | 3' read | 0.8 kb | |||
| BG684208 | cDNA clone IMAGE:4763673 | primary b-cells from tonsils (cell line) | 5' read | |||
| AL135639 | cDNA clone DKFZp762J074 | melanoma (mewo cell line) | 5' read | |||
| AI858632 | cDNA clone IMAGE:2427413 | uterus | 3' read | 0.6 kb | ||
| BF794156 | cDNA clone IMAGE:4338777 | lymphoma, cell line | 5' read | |||
| AW768439 | cDNA clone IMAGE:3001070 | lymph | 3' read | |||
| AI370302 | cDNA clone IMAGE:1987508 | uterus | 3' read | 2.2 kb | ||
| AW630241 | cDNA clone IMAGE:2969093 | 2 pooled high-grade transitional cell tumors | 5' read | |||
| BF206174 | cDNA clone IMAGE:4098133 | neuroblastoma | 5' read | | ||
| BF316952 | cDNA clone IMAGE:4136329 | neuroblastoma | 5' read | | ||
| BE262697 | cDNA clone IMAGE:3502328 | neuroblastoma | 5' read | |||
| BG287370 | cDNA clone IMAGE:4499745 | transitional cell papilloma, cell line | 5' read | |||
| AI865895 | cDNA clone IMAGE:2422462 | pancreas | 3' read | 1.4 kb | | |
| AW613755 | cDNA clone IMAGE:2969093 | 2 pooled high-grade transitional cell tumors | 3' read | |