

| Candidate UniGene cluster: | UniGene Cluster Hs.94037 |
| Description: | hypothetical protein FLJ23053 |
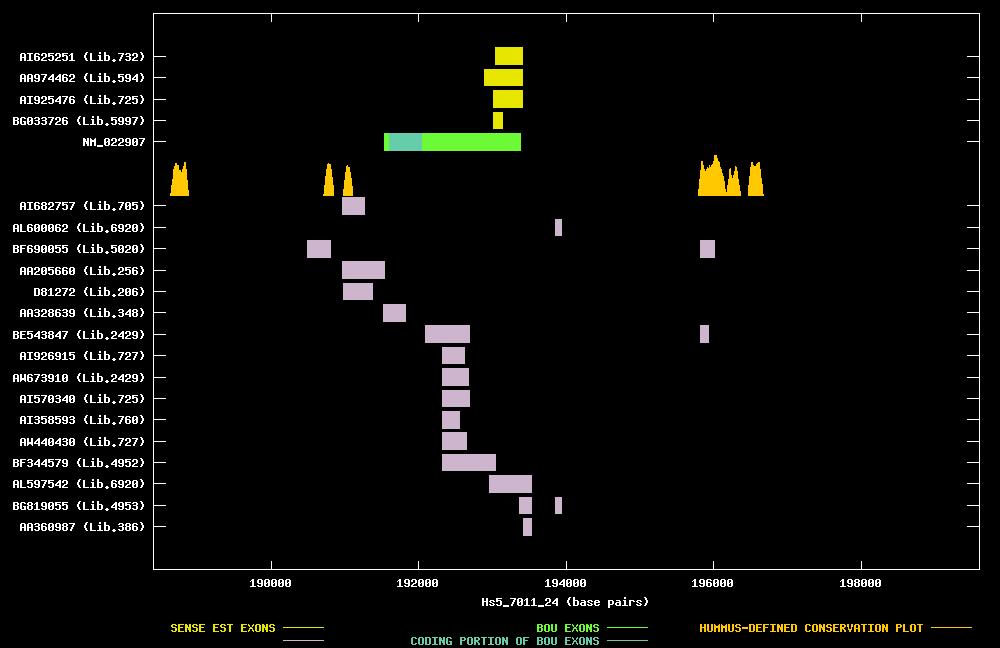
| Best-Of-UniGene (BOU) Sequence | NM_022907 |
| Genomic Coordiantes Displayed: | Bases 188400 to 199600 of contig Hs5_7011_24 |
| BOU Orientation Along Contig: | LEFT-TO-RIGHT with respect to contig |
| Link to JPEG of genomic mapping | Hs.94037.jpeg |
| Best sense EST/protein match: | No protein match with an e-value of less than 1e-10 |
| Best antisense EST/protein match: | AA328639 matched ref|XP_028551.1| (XM_028551) hypothetical protein XP_028551 [Homo sapiens] (E = 5e-13) |
ANTISENSE ESTs
| AI682757 | cDNA clone IMAGE:2323539 | pancreas | 3' read | 4.2 kb | | |
| AL600062 | cDNA clone DKFZp313A0232 | 5' read | ||||
| BF690055 | cDNA clone IMAGE:4298390 | melanotic melanoma, high mdr (cell line) | 3' read | | ||
| AA205660 | cDNA clone IMAGE:646814 | 3' read | | |||
| D81272 | cDNA clone GEN142G09 | brain | 5' read | |||
| AA328639 | cDNA clone ATCC:130289 | whole embryo | 5' read | |||
| BE543847 | cDNA clone IMAGE:3457735 | choriocarcinoma | 5' read | | ||
| AI926915 | cDNA clone IMAGE:2444139 | uterus | 3' read | 0.9 kb | ||
| AW673910 | cDNA clone IMAGE:2985685 | choriocarcinoma | 3' read | |||
| AI570340 | cDNA clone IMAGE:2184382 | stomach | 3' read | 1.4 kb | ||
| AI358593 | cDNA clone IMAGE:1993574 | uterus | 3' read | 1.2 kb | ||
| AW440430 | cDNA clone IMAGE:2890483 | uterus | 3' read | |||
| BF344579 | cDNA clone IMAGE:4150847 | glioblastoma with egfr amplification | 5' read | |||
| AL597542 | cDNA clone DKFZp313H2114 | 5' read | ||||
| BG819055 | cDNA clone IMAGE:4932126 | anaplastic oligodendroglioma with 1p/19q loss | 5' read | | ||
| AA360987 | cDNA clone ATCC:165132 | lymph | 5' read |
| BG033726 | cDNA clone IMAGE:4402534 | mammary adenocarcinoma, cell line | 5' read |