

| Candidate UniGene cluster: | UniGene Cluster Mm.148209 |
| Description: | synaptonemal complex protein 3 |
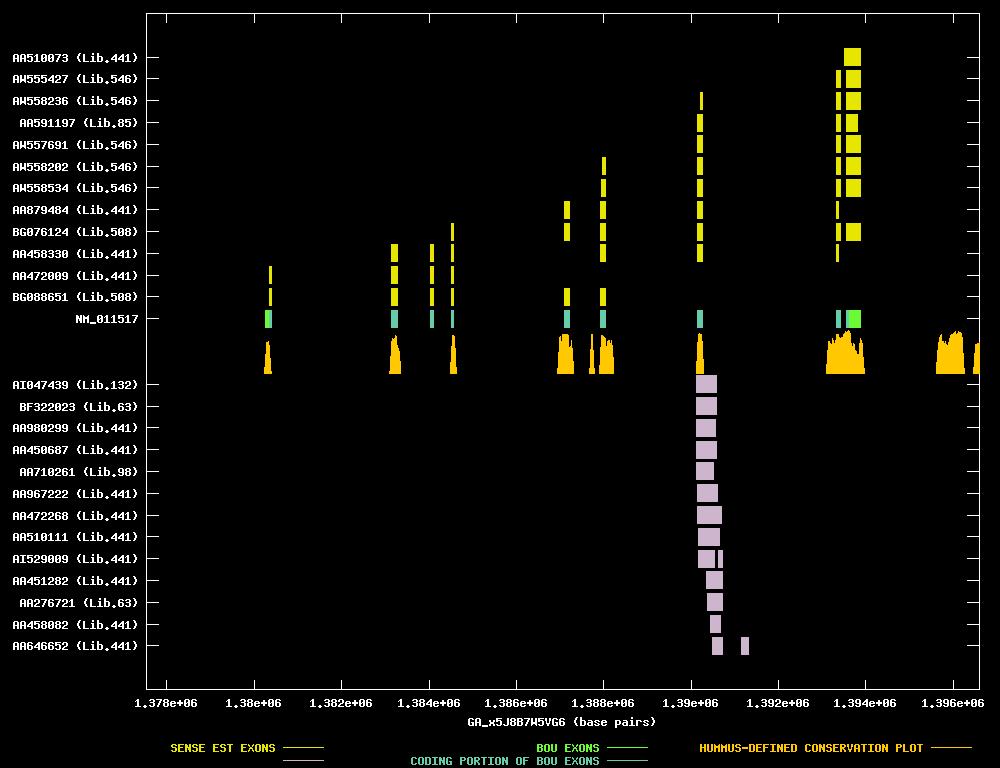
| Best-Of-UniGene (BOU) Sequence | NM_011517 |
| Genomic Coordiantes Displayed: | Bases 1377531 to 1396603 of contig GA_x5J8B7W5VG6 |
| BOU Orientation Along Contig: | LEFT-TO-RIGHT with respect to contig |
| Link to JPEG of genomic mapping | Mm.148209.jpeg |
| Best sense EST/protein match: | NM_011517 matched ref|NP_035647.1| (NM_011517) synaptonemal complex protein 3 [Mus musculus] (E = e-132) |
| Best antisense EST/protein match: | No protein match with an e-value of less than 1e-10 |
ANTISENSE ESTs
| AI047439 | cDNA clone IMAGE:1450386 | liver | 3' read | | ||
| BF322023 | cDNA clone IMAGE:3411509 | spleen | 3' read | | ||
| AA980299 | cDNA clone IMAGE:1348506 | mammary gland | 5' read | | ||
| AA450687 | cDNA clone IMAGE:850127 | mammary gland | 5' read | | ||
| AA710261 | cDNA clone IMAGE:1166429 | colon | 5' read | | ||
| AA967222 | cDNA clone IMAGE:1331784 | mammary gland | 5' read | | ||
| AA472268 | cDNA clone IMAGE:875107 | mammary gland | 5' read | | ||
| AA510111 | cDNA clone IMAGE:891054 | mammary gland | 5' read | | ||
| AI529009 | cDNA clone IMAGE:1448724 | mammary gland | 5' read | |||
| AA451282 | cDNA clone IMAGE:850427 | mammary gland | 5' read | |||
| AA276721 | cDNA clone IMAGE:777467 | spleen | 5' read | |||
| AA458082 | cDNA clone IMAGE:864279 | mammary gland | 5' read | |||
| AA646652 | cDNA clone IMAGE:820819 | mammary gland | 5' read |
| BG088651 | cDNA clone H3155H10 | 5' read | | |||
| AA472009 | cDNA clone IMAGE:874980 | mammary gland | 5' read | | ||
| AA458330 | cDNA clone IMAGE:864615 | mammary gland | 5' read | | ||
| BG076124 | cDNA clone H3155H10 | 3' read | | |||
| AA879484 | cDNA clone IMAGE:1230236 | mammary gland | 5' read | | ||
| AW558534 | cDNA clone L0295C05 | 3' read | | |||
| AW558202 | cDNA clone L0291H08 | 3' read | | |||
| AW557691 | cDNA clone L0285A06 | 3' read | | |||
| AA591197 | cDNA clone IMAGE:990120 | embryo | 5' read | | ||
| AW558236 | cDNA clone L0292D01 | 3' read | | |||
| AW555427 | cDNA clone L0255G07 | 3' read | | |||
| AA510073 | cDNA clone IMAGE:863320 | mammary gland | 5' read |