

| Candidate UniGene cluster: | UniGene Cluster Mm.19726 |
| Description: | dynein, axon, heavy chain 11 |
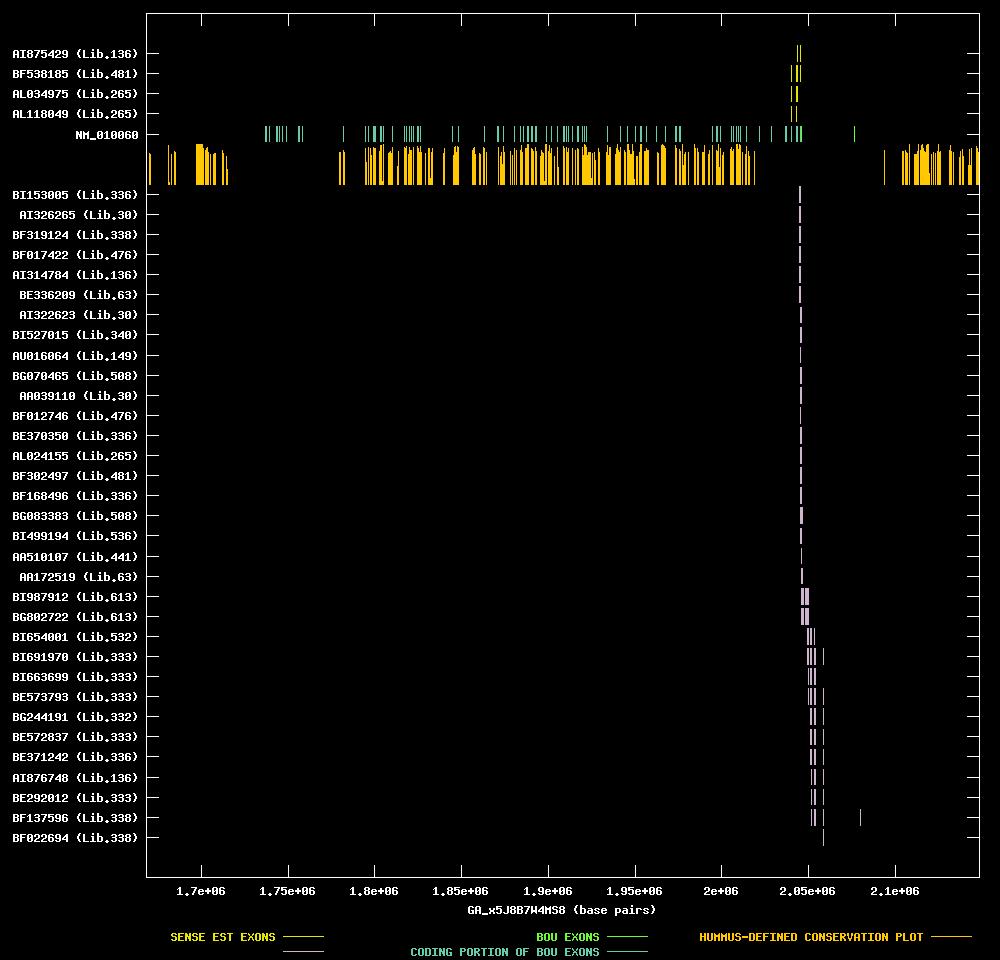
| Best-Of-UniGene (BOU) Sequence | NM_010060 |
| Genomic Coordiantes Displayed: | Bases 1668253 to 2148562 of contig GA_x5J8B7W4MS8 |
| BOU Orientation Along Contig: | LEFT-TO-RIGHT with respect to contig |
| Link to JPEG of genomic mapping | Mm.19726.jpeg |
| Best sense EST/protein match: | BF538185 matched ref|NP_034190.1| (NM_010060) dynein, axon, heavy chain 11; situs inversus viscerum (E = e-119) |
| Best antisense EST/protein match: | BI654001 matched gb|AAH06933.1|AAH06933 (BC006933) Unknown (protein for MGC:11998) [Mus musculus] (E = e-102) |
ANTISENSE ESTs
| BI153005 | cDNA clone IMAGE:5068535 | spontaneous tumor, metastatic to mammary. stem cell origin. | 5' read | | ||
| AI326265 | cDNA clone IMAGE:474743 | embryo | 3' read | | ||
| BF319124 | cDNA clone IMAGE:3663217 | tumor, metastatic to mammary | 3' read | | ||
| BF017422 | cDNA clone IMAGE:3654120 | type b spermatogonia, pooled from multiple mice | 3' read | | ||
| AI314784 | cDNA clone IMAGE:1921934 | kidney | 3' read | | ||
| BE336209 | cDNA clone IMAGE:3325278 | spleen | 5' read | | ||
| AI322623 | cDNA clone IMAGE:474743 | embryo | 5' read | |||
| BI527015 | cDNA clone IMAGE:5059533 | tumor, biopsy sample | 5' read | | ||
| AU016064 | cDNA clone J0720B12 | embryo | 3' read | | ||
| BG070465 | cDNA clone H3087F06 | 3' read | | |||
| AA039110 | cDNA clone IMAGE:474743 | embryo | 5' read | | ||
| BF012746 | cDNA clone IMAGE:3654120 | type b spermatogonia, pooled from multiple mice | 5' read | |