
| Candidate UniGene cluster: | UniGene Cluster Mm.210047 |
| Description: | RIKEN cDNA 2010309H15 gene |
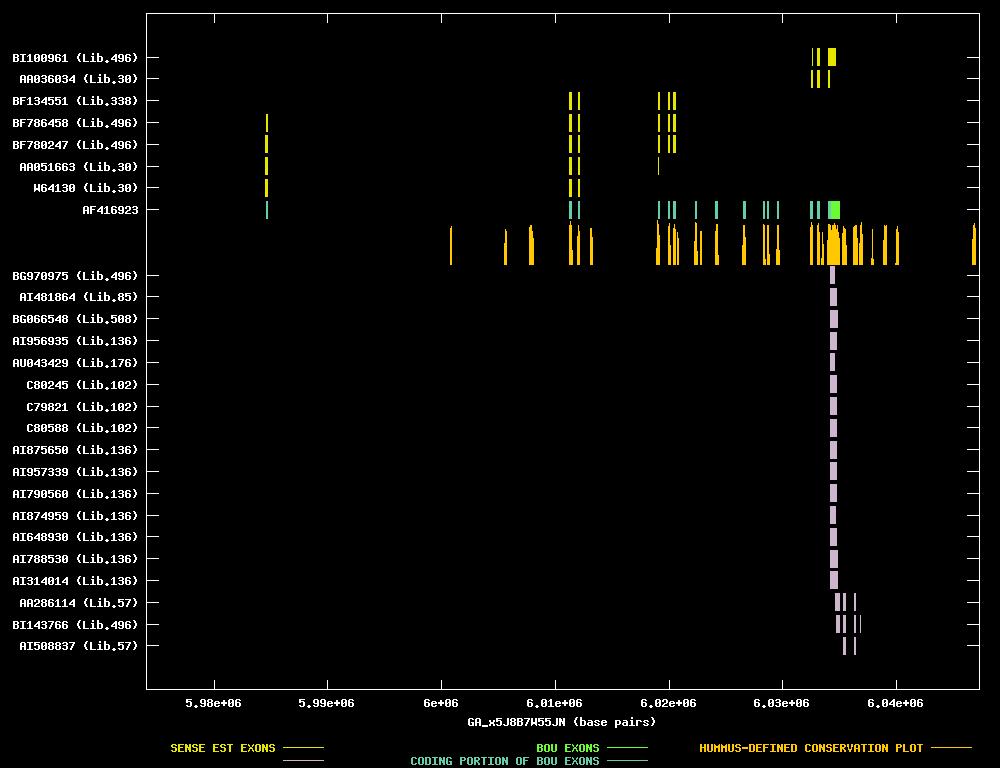
| Best-Of-UniGene (BOU) Sequence | AF416923 |
| Genomic Coordiantes Displayed: | Bases 5974065 to 6047288 of contig GA_x5J8B7W55JN |
| BOU Orientation Along Contig: | LEFT-TO-RIGHT with respect to contig |
| Link to JPEG of genomic mapping | Mm.210047.jpeg |
| Best sense EST/protein match: | AF416923 matched gb|AAL40939.1|AF416923_1 (AF416923) brown fat inducible thioesterase 2 [Mus musculus] (E = 0.0) |
| Best antisense EST/protein match: | AI314014 matched gb|AAH20874.1|AAH20874 (BC020874) Unknown (protein for MGC:24088) [Homo sapiens] (E = 5e-73) |
ANTISENSE ESTs
| BG970975 | cDNA clone IMAGE:4974570 | kidney | 5' read | |||
| AI481864 | cDNA clone IMAGE:934865 | embryo | 3' read | | ||
| BG066548 | cDNA clone H3045C01 | 3' read | | |||
| AI956935 | cDNA clone IMAGE:2135957 | kidney | 3' read | | ||
| AU043429 | cDNA clone J0904G08 | 3' read | | |||
| C80245 | cDNA clone J0078F04 | embryo | 3' read | | ||
| C79821 | cDNA clone J0072D12 | embryo | 3' read | | ||
| C80588 | cDNA clone J0084F04 | embryo | 3' read | | ||
| AI875650 | cDNA clone IMAGE:1972498 | kidney | 3' read | | ||
| AI957339 | cDNA clone IMAGE:2158938 | kidney | 3' read | |||
| AI790560 | cDNA clone IMAGE:2064909 | kidney | 3' read | |||
| AI874959 | cDNA clone IMAGE:2099566 | kidney | 3' read | |||
| AI648930 | cDNA clone IMAGE:1970766 | kidney | 3' read | |||
| AI788530 | cDNA clone IMAGE:1972013 | kidney | 3' read | |||
| AI314014 | cDNA clone IMAGE:1920902 | kidney | 3' read | |||
| AA286114 | cDNA clone IMAGE:776415 | kidney | 5' read | |||
| BI143766 | cDNA clone IMAGE:5064271 | kidney | 5' read | |||
| AI508837 | cDNA clone IMAGE:776415 | kidney | 5' read |
| W64130 | cDNA clone IMAGE:385649 | embryo | 5' read |  | ||
| AA051663 | cDNA clone IMAGE:479707 | embryo | 5' read | | ||
| BF780247 | cDNA clone IMAGE:4221466 | kidney | 5' read | | ||
| BF786458 | cDNA clone IMAGE:4240966 | kidney | 5' read | | ||
| BF134551 | cDNA clone IMAGE:4012743 | tumor, metastatic to mammary | 5' read | | ||
| AA036034 | cDNA clone IMAGE:469019 | embryo | 5' read | | ||
| BI100961 | cDNA clone IMAGE:5041677 | kidney | 5' read | |