

| Candidate UniGene cluster: | UniGene Cluster Mm.2560 |
| Description: | Rap2 interacting protein |
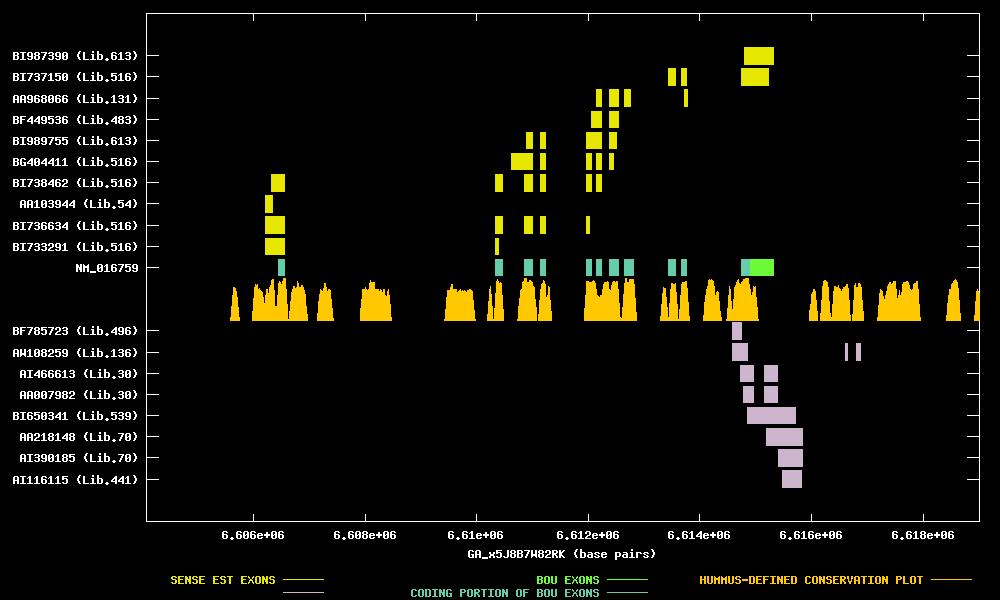
| Best-Of-UniGene (BOU) Sequence | NM_016759 |
| Genomic Coordiantes Displayed: | Bases 6604081 to 6619012 of contig GA_x5J8B7W82RK |
| BOU Orientation Along Contig: | LEFT-TO-RIGHT with respect to contig |
| Link to JPEG of genomic mapping | Mm.2560.jpeg |
| Best sense EST/protein match: | BI738462 matched ref|NP_058039.1| (NM_016759) Rap2 interacting protein; Rap2 interacting protein 8 (E = e-108) |
| Best antisense EST/protein match: | AW108259 matched gb|AAH13441.1|AAH13441 (BC013441) Similar to solute carrier family 3, member 1 [Mus (E = 3e-37) |
ANTISENSE ESTs
| BF785723 | cDNA clone IMAGE:4240544 | kidney | 5' read | | ||
| AW108259 | cDNA clone IMAGE:2192817 | kidney | 3' read | | ||
| AI466613 | cDNA clone IMAGE:438934 | embryo | 5' read | | ||
| AA007982 | cDNA clone IMAGE:438934 | embryo | 5' read | |||
| BI650341 | cDNA clone IMAGE:5336966 | tumor, gross tissue | 5' read | |||
| AA218148 | cDNA clone IMAGE:659547 | embryo | 5' read | |||
| AI390185 | cDNA clone IMAGE:659547 | embryo | 5' read | |||
| AI116115 | cDNA clone IMAGE:1398145 | mammary gland | 5' read |
| BI733291 | cDNA clone IMAGE:5360076 | retina | 5' read | |||
| BI736634 | cDNA clone IMAGE:5367314 | retina | 5' read | | ||
| AA103944 | cDNA clone IMAGE:556512 | embryo | 5' read | |||
| BI738462 | cDNA clone IMAGE:5366072 | retina | 5' read | | ||
| BG404411 | cDNA clone IMAGE:4527270 | retina | 5' read | | ||
| BI989755 | cDNA clone (no-name) | neural retina | ||||
| BF449536 | cDNA clone IMAGE:3813981 | brain | 5' read | | ||
| AA968066 | cDNA clone IMAGE:1617383 | hypothalamus | 5' read | | ||
| BI737150 | cDNA clone IMAGE:5368166 | retina | 5' read | | ||
| BI987390 | cDNA clone (no-name) | neural retina | |