

| Candidate UniGene cluster: | UniGene Cluster Mm.29014 |
| Description: | T-cell lymphoma invasion and metastasis 2 |
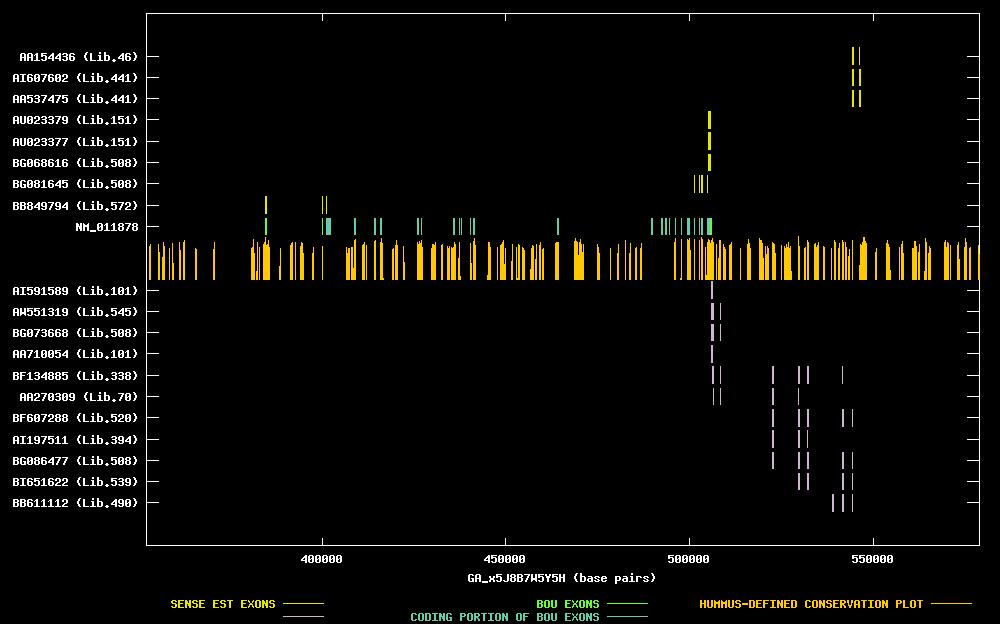
| Best-Of-UniGene (BOU) Sequence | NM_011878 |
| Genomic Coordiantes Displayed: | Bases 352215 to 578915 of contig GA_x5J8B7W5Y5H |
| BOU Orientation Along Contig: | LEFT-TO-RIGHT with respect to contig |
| Link to JPEG of genomic mapping | Mm.29014.jpeg |
| Best sense EST/protein match: | NM_011878 matched ref|NP_036008.1| (NM_011878) T-cell lymphoma invasion and metastasis 2; RAS-related C3 (E = 0.0) |
| Best antisense EST/protein match: | BF607288 matched ref|XP_011456.1| (XM_011456) CGI-75 protein [Homo sapiens] (E = e-100) |
ANTISENSE ESTs
| AI591589 | cDNA clone IMAGE:1165492 | colon | 3' read | | ||
| AW551319 | cDNA clone L0076G12 | 3' read | | |||
| BG073668 | cDNA clone H3126F08 | 3' read | | |||
| AA710054 | cDNA clone IMAGE:1165492 | colon | 5' read | |||
| BF134885 | cDNA clone IMAGE:4007324 | tumor, metastatic to mammary | 5' read | | ||
| AA270309 | cDNA clone IMAGE:735608 | embryo | 5' read | | ||
| BF607288 | cDNA clone ICRFp522O0944 | whole embryo | 5' read | | ||
| AI197511 | cDNA clone IMAGE:1449879 | uterus | 5' read | | ||
| BG086477 | cDNA clone H3126F08 | 5' read | | |||
| BI651622 | cDNA clone IMAGE:5338327 | tumor, gross tissue | 5' read | | ||
| BB611112 | cDNA clone 2810005G14 | 5' read | |
| BB849794 | cDNA clone F930103D15 | inner ear | 5' read | |||
| BG081645 | cDNA clone H3067E02 | 5' read | | |||
| BG068616 | cDNA clone H3067E02 | 3' read | | |||
| AU023377 | cDNA clone J0431A12 | unfertilized egg | 3' read | | ||
| AU023379 | cDNA clone J0431B09 | unfertilized egg | 3' read | | ||
| AA537475 | cDNA clone IMAGE:949774 | mammary gland | 5' read | | ||
| AI607602 | cDNA clone IMAGE:949774 | mammary gland | 5' read | | ||
| AA154436 | cDNA clone IMAGE:605120 | embryonal carcinoma | 5' read | |