

| Candidate UniGene cluster: | UniGene Cluster Mm.30083 |
| Description: | RIKEN cDNA 2510015F01 gene |
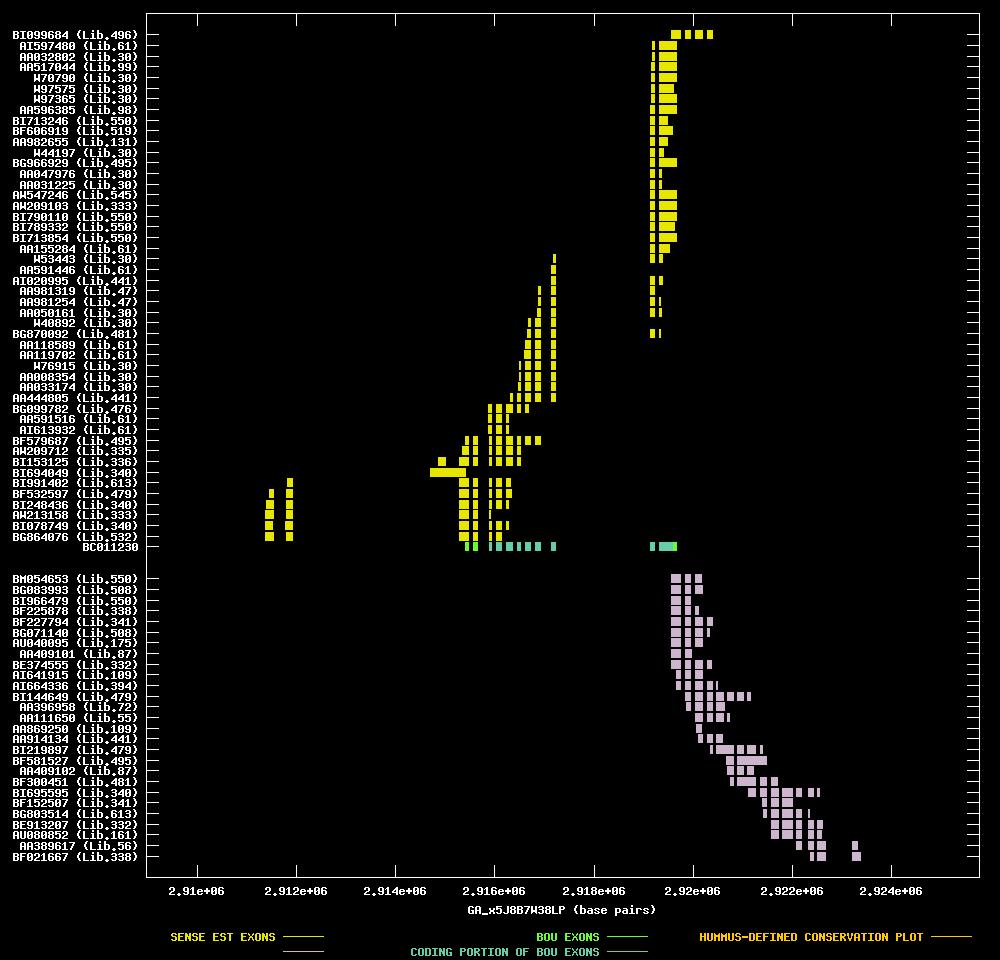
| Best-Of-UniGene (BOU) Sequence | BC011230 |
| Genomic Coordiantes Displayed: | Bases 2908979 to 2925768 of contig GA_x5J8B7W38LP |
| BOU Orientation Along Contig: | LEFT-TO-RIGHT with respect to contig |
| Link to JPEG of genomic mapping | Mm.30083.jpeg |
| Best sense EST/protein match: | BC011230 matched ref|NP_075059.1| (NM_022908) hypothetical protein FLJ12442 [Homo sapiens] (E = 0.0) |
| Best antisense EST/protein match: | BG803514 matched dbj|BAA13377.1| (D87433) KIAA0246 protein [Homo sapiens] (E = e-100) |
ANTISENSE ESTs
| BM054653 | cDNA clone (no-name) | 5' read | | |||
| BG083993 | cDNA clone H3095B05 | 5' read | ||||
| BI966479 | cDNA clone (no-name) | 3' read | | |||
| BF225878 | cDNA clone IMAGE:3663004 | tumor, metastatic to mammary | 3' read | | ||
| BF227794 | cDNA clone IMAGE:3670939 | tumor, gross tissue | 3' read | | ||
| BG071140 | cDNA clone H3095B05 | 3' read | | |||
| AU040095 | cDNA clone J0800A01 | 3' read | | |||
| AA409101 | cDNA clone C0037A04 | embryo | 3' read | | ||
| BE374555 | cDNA clone IMAGE:3583736 | tumor, biopsy sample | 5' read | |||
| AI641915 | cDNA clone IMAGE:1097600 | bowel | 5' read | | ||
| AI664336 | cDNA clone IMAGE:1497852 | uterus | 5' read | | ||
| BI144649 | cDNA clone IMAGE:5051312 | liver | 5' read | | ||
| AA396958 | cDNA clone IMAGE:693056 | liver | 5' read | | ||
| AA111650 | cDNA clone IMAGE:555616 | embryo | 5' read | | ||
| AA869250 | cDNA clone IMAGE:1097600 | bowel | 5' read |