
| Candidate UniGene cluster: | UniGene Cluster Mm.4501 |
| Description: | prostaglandin E receptor 1 (subtype EP1), 42kD |
| Best-Of-UniGene (BOU) Sequence | NM_013641 |
| Genomic Coordiantes Displayed: | Bases 1246315 to 1251166 of contig GA_x5J8B7W3E7T |
| BOU Orientation Along Contig: | LEFT-TO-RIGHT with respect to contig |
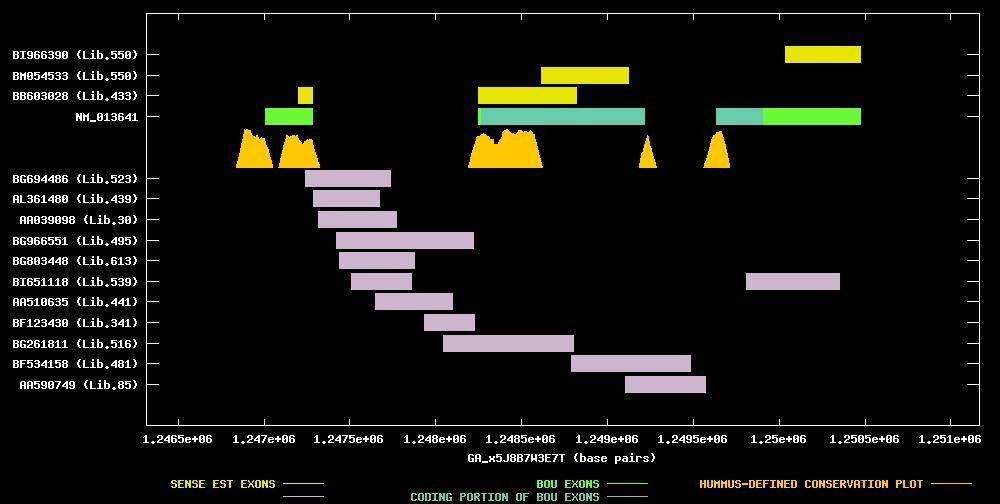
| Link to JPEG of genomic mapping | Mm.4501.jpeg |
| Best sense EST/protein match: | NM_013641 matched ref|NP_038669.1| (NM_013641) prostaglandin E receptor EP1 subtype [Mus musculus] (E = e-139) |
| Best antisense EST/protein match: | No protein match with an e-value of less than 1e-10 |
ANTISENSE ESTs
| BG694486 | cDNA clone IMAGE:4316456 | pituitary gland | 5' read | |||
| AL361480 | cDNA clone A9C29D62 | embryo | 5' read | |||
| AA039098 | cDNA clone IMAGE:474714 | embryo | 5' read | |||
| BG966551 | cDNA clone IMAGE:4987458 | colon | 5' read | |||
| BG803448 | cDNA clone (no-name) | neural retina | ||||
| BI651118 | cDNA clone IMAGE:5338244 | tumor, gross tissue | 5' read | | ||
| AA510635 | cDNA clone IMAGE:863536 | mammary gland | 5' read | |||
| BF123430 | cDNA clone IMAGE:4023751 | tumor, gross tissue | 5' read | | ||
| BG261811 | cDNA clone IMAGE:4481448 | retina | 5' read | | ||
| BF534158 | cDNA clone IMAGE:4187074 | salivary gland | 5' read | | ||
| AA590749 | cDNA clone IMAGE:990448 | embryo | 5' read | |
| BB603028 | cDNA clone D730005P21 | mammary gland | | |||
| BM054533 | cDNA clone (no-name) | 5' read | ||||
| BI966390 | cDNA clone (no-name) | 3' read |