
| Candidate UniGene cluster: | UniGene Cluster Mm.45552 |
| Description: | RIKEN cDNA 1700030E05 gene |
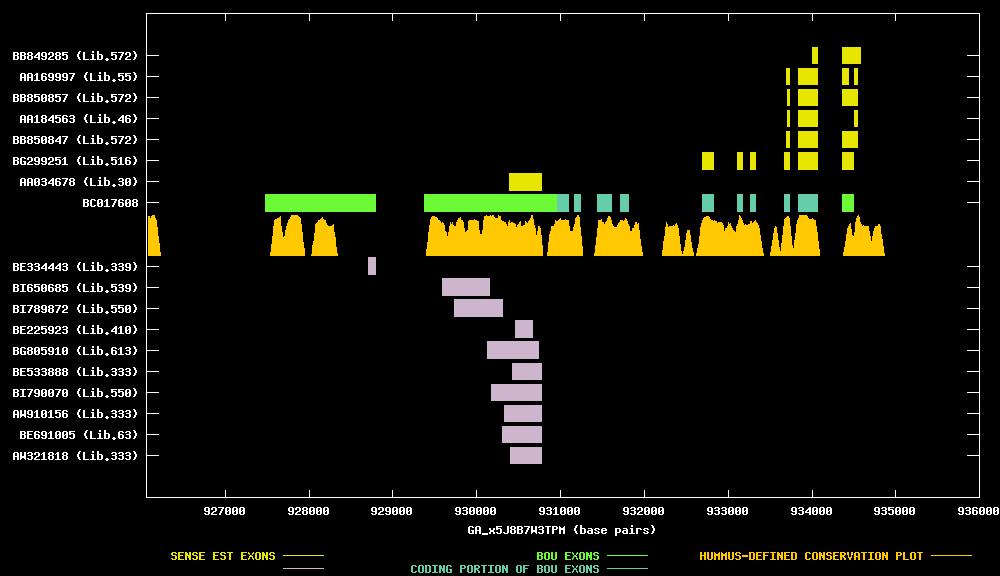
| Best-Of-UniGene (BOU) Sequence | BC017608 |
| Genomic Coordiantes Displayed: | Bases 926059 to 935996 of contig GA_x5J8B7W3TPM |
| BOU Orientation Along Contig: | RIGHT-TO-LEFT with respect to contig |
| Link to JPEG of genomic mapping | Mm.45552.jpeg |
| Best sense EST/protein match: | BC017608 matched ref|NP_076279.1| (NM_023790) RIKEN cDNA 1700030E05 [Mus musculus] (E = 0.0) |
| Best antisense EST/protein match: | BG805910 matched ref|NP_033132.1| (NM_009106) rhotekin [Mus musculus] (E = 1e-37) |
ANTISENSE ESTs
| BE334443 | cDNA clone IMAGE:3257380 | tumor, gross tissue | 5' read | |||
| BI650685 | cDNA clone IMAGE:5337656 | tumor, gross tissue | 5' read | |||
| BI789872 | cDNA clone (no-name) | 5' read | ||||
| BE225923 | cDNA clone (no-name) | pancreatic bud | 3' read | |||
| BG805910 | cDNA clone (no-name) | neural retina | ||||
| BE533888 | cDNA clone IMAGE:3597498 | infiltrating ductal carcinoma | 5' read | |||
| BI790070 | cDNA clone (no-name) | 3' read | | |||
| AW910156 | cDNA clone IMAGE:3157509 | infiltrating ductal carcinoma | 3' read | | ||
| BE691005 | cDNA clone IMAGE:3411008 | spleen | 3' read | | ||
| AW321818 | cDNA clone IMAGE:2609590 | infiltrating ductal carcinoma | 3' read | |
| AA034678 | cDNA clone IMAGE:466059 | embryo | 5' read | |||
| BG299251 | cDNA clone IMAGE:4507671 | retina | 5' read | |||
| BB850847 | cDNA clone F930109J05 | inner ear | 5' read | |||
| AA184563 | cDNA clone IMAGE:633327 | embryonal carcinoma | 5' read | |||
| BB850857 | cDNA clone F930109K05 | inner ear | 5' read | |||
| AA169997 | cDNA clone IMAGE:614822 | embryo | 5' read | |||
| BB849285 | cDNA clone F930008H23 | inner ear | 5' read |