| Candidate UniGene cluster: | UniGene Cluster Mm.944 |
| Description: | integral membrane glycoprotein |
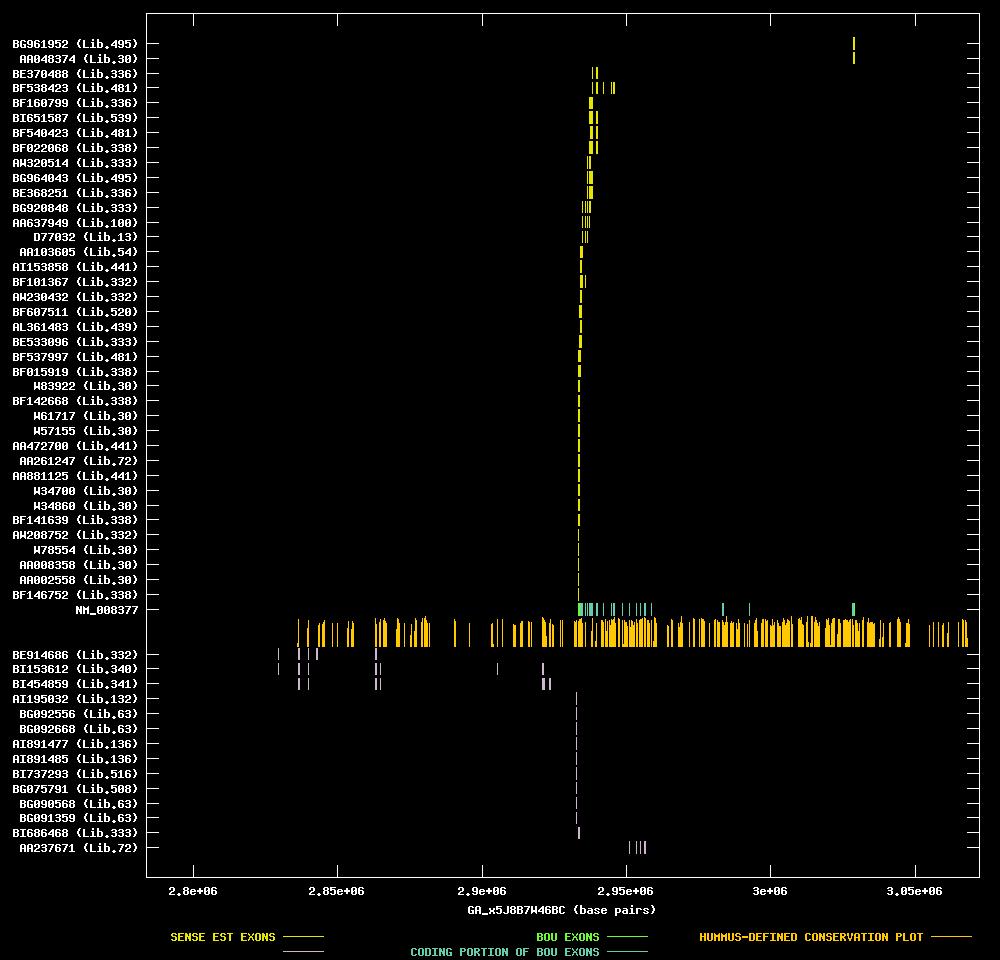
| Best-Of-UniGene (BOU) Sequence | NM_008377 |
| Genomic Coordiantes Displayed: | Bases 2783800 to 3072200 of contig GA_x5J8B7W46BC |
| BOU Orientation Along Contig: | RIGHT-TO-LEFT with respect to contig |
| Link to JPEG of genomic mapping | Mm.944.jpeg |
| Best sense EST/protein match: | AA637949 matched ref|NP_032403.1| (NM_008377) integral membrane glycoprotein [Mus musculus] (E = e-101) |
| Best antisense EST/protein match: | BI454859 matched dbj|BAB30050.1| (AK015954) Mitochondrial carrier proteins containing protein~data (E = 2e-52) |
SENSE ESTs
| |
BF146752 |
cDNA clone IMAGE:3660514 |
tumor, metastatic to mammary |
3' read |
|
 |
| |
AA002558 |
cDNA clone IMAGE:427620 |
embryo |
5' read |
|
|
| |
AA008358 |
cDNA clone IMAGE:438805 |
embryo |
5' read |
|
|
| |
W78554 |
cDNA clone IMAGE:401818 |
embryo |
5' read |
|
|
| |
AW208752 |
cDNA clone IMAGE:2647236 |
tumor, biopsy sample |
3' read |
|
|
| |
BF141639 |
cDNA clone IMAGE:4016777 |
tumor, metastatic to mammary |
5' read |
|
|
| |
W34860 |
cDNA clone IMAGE:353095 |
embryo |
5' read |
|
|
| |
W34700 |
cDNA clone IMAGE:352863 |
embryo |
5' read |
|
|
| |
AA881125 |
cDNA clone IMAGE:1314959 |
mammary gland |
5' read |
|
|
| |
AA261247 |
cDNA clone IMAGE:747849 |
liver |
5' read |
|
|
| |
AA472700 |
cDNA clone IMAGE:875209 |
mammary gland |
5' read |
|
|
| |
W57155 |
cDNA clone IMAGE:372522 |
embryo |
5' read |
|
|
| |
W61717 |
cDNA clone IMAGE:372529 |
embryo |
5' read |
|
|
| |
BF142668 |
cDNA clone IMAGE:4020482 |
tumor, metastatic to mammary |
5' read |
|
|
| |
W83922 |
cDNA clone IMAGE:406913 |
embryo |
5' read |
|
|
| |
BF015919 |
cDNA clone IMAGE:3660514 |
tumor, metastatic to mammary |
5' read |
|
|
| |
BF537997 |
cDNA clone IMAGE:4188731 |
salivary gland |
5' read |
|
|
| |
BE533096 |
cDNA clone IMAGE:3596055 |
infiltrating ductal carcinoma |
5' read |
|
 |
| |
AL361483 |
cDNA clone M9128A32 |
embryo |
5' read |
|
|
| |
BF607511 |
cDNA clone ICRFp522H0254 |
whole embryo |
5' read |
|
|
| |
AW230432 |
cDNA clone IMAGE:2647236 |
tumor, biopsy sample |
5' read |
|
|
| |
BF101367 |
cDNA clone IMAGE:3980536 |
tumor, biopsy sample |
5' read |
|
|
| |
AI153858 |
cDNA clone IMAGE:1449245 |
mammary gland |
5' read |
|
|
| |
AA103605 |
cDNA clone IMAGE:555998 |
embryo |
5' read |
|
|
| |
D77032 |
cDNA clone 94A08 |
embryonal carcinoma |
|
|
|
| |
AA637949 |
cDNA clone IMAGE:1121390 |
muscle |
5' read |
|
|
| |
BG920848 |
cDNA clone IMAGE:4953488 |
infiltrating ductal carcinoma |
5' read |
|
|
| |
BE368251 |
cDNA clone IMAGE:3590708 |
spontaneous tumor, metastatic to mammary. stem cell origin. |
5' read |
|
|
| |
BG964043 |
cDNA clone IMAGE:4983788 |
colon |
5' read |
|
|
| |
AW320514 |
cDNA clone IMAGE:2609635 |
infiltrating ductal carcinoma |
5' read |
|
|
| |
BF022068 |
cDNA clone IMAGE:3662607 |
tumor, metastatic to mammary |
5' read |
|
|
| |
BF540423 |
cDNA clone IMAGE:4189677 |
salivary gland |
5' read |
|
|
| |
BI651587 |
cDNA clone IMAGE:5338934 |
tumor, gross tissue |
5' read |
|
|
| |
BF160799 |
cDNA clone IMAGE:3990312 |
spontaneous tumor, metastatic to mammary. stem cell origin. |
5' read |
|
|
| |
BF538423 |
cDNA clone IMAGE:4192996 |
salivary gland |
5' read |
|
|
| |
BE370488 |
cDNA clone IMAGE:3587222 |
spontaneous tumor, metastatic to mammary. stem cell origin. |
5' read |
|
|
| |
AA048374 |
cDNA clone IMAGE:477450 |
embryo |
5' read |
|
|
| |
BG961952 |
cDNA clone IMAGE:4981214 |
colon |
5' read |
|
|