Fluorescent
in situ Sequencing on Polymerase
Colonies
Robi
D. Mitra1, Jay Shendure1, Jerzy Olejnik2, Edyta
Krzymanska-Olejnik2, and
George M. Church1*
Analytical Biochemistry (2003, in press)
1Lipper
Center for Computational Genetics and Department of Genetics, Harvard Medical
School, 200 Longwood Ave., Boston, MA 02115.
2AmberGen,
Inc., 1106 Commonwealth Ave, Boston,
MA 02215.
*Corresponding
author: church@arep.med.harvard.edu
Questions regarding this document, protocols & software can also be directed to Rob Mitra (rmitra@rascal.med.harvard.edu) or Jay Shendure (jay_shendure@student.hms.harvard.edu)
F.
Linearity and Multiple Nucleotide IncorporationsM.
To
ascertain how long DNA polymerase remains trapped on DNA within a polony, we
trapped Klenow polymerase onto a polony template and washed the slide in a large
volume of low salt buffer with shaking for seventy-two hours.
After washing, a fluorescent nucleotide extension reaction was performed
without adding additional DNA polymerase. The
incorporated fluorescence was approximately the same as when the washing step
was omitted (figure S1), indicating that the DNA polymerase remains bound to the
DNA for at least 72 hours.
B.
Sulfhydryl-cleavable
Deoxynucleotide Analogue Structures & Synthesis
We
designed structures of sulfydryl-cleavable deoxynucleotide analogues, and had the
molecules custom-synthesized (Perkin Elmer / NEN).
The structures are presented in the main paper (figure 4a)
and below (figure S2). Details of
the synthesis and the nucleotide analogues themselves are available from Perkin
Elmer / NEN.

Figure
S2. Structures of
sulfhydryl-cleavable deoxynucleotide analogues.
The structure of Cy5-SS-dCTP is presented in the main body of the
manuscript.
C. Synthesis of Photocleavable Fluorophore Deoxyuridine Triphosphate Conjugates
Two compounds were
synthesized, BODIPY-FL-PC-dUTP and Cy5-PC-dUTP. The synthesis scheme is
presented in Figure S3.
BODIPY-FL-PC-dUTP
Compound 5
(0.23 µmol) was dissolved in 100 µl of 50 mM NaHCO3 and then 73 µl
(8 eqs.) of BODIPY-FL-SE (25 mM solution in DMF, Molecular Probes) was added.
Reaction mixture was incubated for 2 hrs at room temperature and the product
isolated using RP-HPLC as described above. Fractions containing the desired
product were pooled and freeze-dried to give 36 nmoles of compound 6
(based on BODIPY-FL fluorophore absorption, Absorption max = 505 nm, e
= 80,000).
Cy5-PC-dUTP
Compound 5 (0.24 µmol) was dissolved in 40 µl of 50 mM NaHCO3 and then 0.72 µmol of Cy5 – monoreactive NHS (Amersham-Pharmacia) in 100 µl of DMF was added. Reaction mixture was incubated for 2 hrs at room temperature and the product isolated using RP-HPLC initially on R2/10 RP column (Perseptive Biosystems, 4.6x100 mm) followed by another purification on NovaPak C18, (Waters, 10 x 100 mm). In both case a gradient (0-90%) of acetonitrile in 50 mM triethylammonium acetate (pH 4.5) over 45 minutes with flow rate 1 ml/min. was used. Fractions containing the desired product were identified by performing photocleavage followed by analytical HPLC, pooled and freeze-dried to give 60.5 nmoles of compound 7 (based on Cy5 fluorophore 550 nm absorption maximum, e = 250,000). We were unable to purify this conjugate to homogeneity, even though two different reverse phase HPLC separations were performed. The preparation was used for polony sequencing experiments – the estimated purity was ~50% based on the extent of the conversion of conjugate to the intermediate 5 upon irradiation (Figure S4). The impurity was determined to be the hydrolyzed Cy5-NHS reagent, which did not interfere with the subsequent polony sequencing reactions.
Figure S3. Scheme for synthesis of photoclevable fluorophore deoxyuridine triphosphate conjugates.
Figure S4. Photocleavage/HPLC analysis of BODIPY-FL-PC-dUTP and Cy5-PC-dUTP.
D.
Photo-cleavable Deoxynucleotide Analogue Structure, Cleavability & Extension Efficiencies
We
designed & synthesized a dUTP analogue, Cy5-PC-dUTP, with a photocleavable
linker between the nucleotide and the fluorophore (figure S5a).
To see if DNA polymerase would recognize this analogue, we
performed experiments identical to the ones described in Figure 4 of the main paper, except the extension was performed with the Cy5-PC-dUTP
nucleotide analogue, and light was used as the cleaving agent (figure S5b and
S5c). As expected, we see two types
of polonies, green and yellow, and by further base extensions it was confirmed
that the nucleotide was correctly incorporated.
To characterize the rate and extent the fluorescent signal can be removed
by exposure to light, we exposed the slide to 365 nm light, imaging the slide at
various intervals. After 29 minutes
of exposure, the fluorescence was greatly reduced, although not completely
removed (figure S5d). The
decay of the fluorescent signal can be fitted to an exponential curve that
decays with a time constant of 2.6 minutes to a steady state value equal to 7.5%
of the original fluorescence.
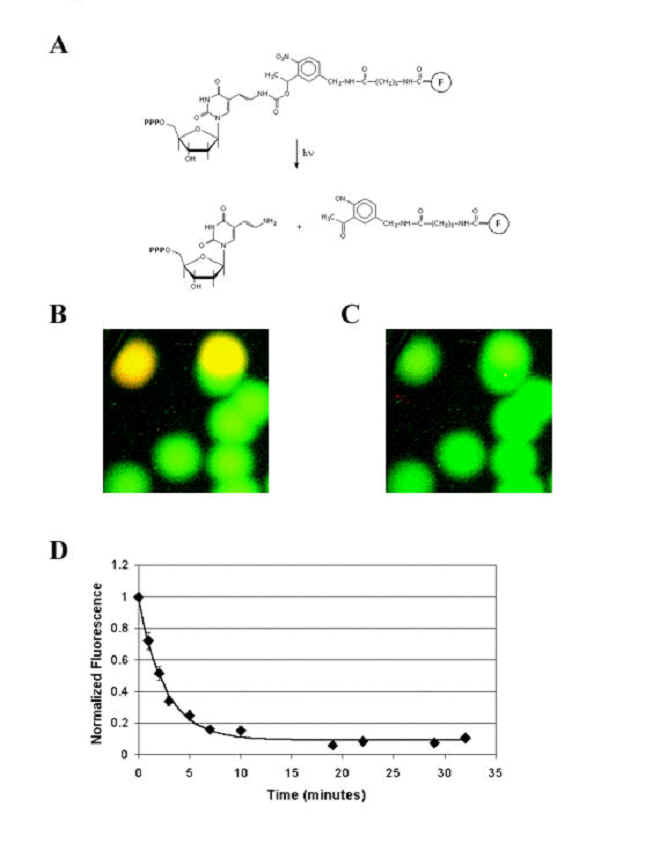
Figure
S5
E.
Titration of Reversibly Dye-labeled
Nucleotide Analogues and Natural Deoxynucleotides.
Because
fluorophores tend to quench one another when they are in close
proximity, we hypothesized that it might be advantageous to perform extension
with a mixture of unlabeled and labeled nucleotide, so that when repeated bases
occur in the sequence, multiple labeled nucleotides are unlikely to be
incorporated into adjacent positions in the growing DNA strand.
DNA polymerase incorporates natural nucleotides more efficiently than
fluorescent nucleotides, so we performed extension reactions with varying ratios
of fluorescent to natural nucleotides and quantified the amount of fluorescence
incorporated (figure S6). The
results indicate a linear relationship between the fraction of fluorescent
nucleotide present in the extension reaction and the normalized signal intensity
values.
Figure S6. Titration of natural and reversibly dye labeled nucleotides. Single base extension reactions were performed using 2 micromolar natural nucleotide and varying amounts of reversibly dye labeled nucleotide. The results are plotted above. The x-axis represents the fraction of total nucleotide concentration included in the extension reaction that is dye labeled. Cy5-SS-dATP is represented by green squares, Cy5-SS-dCTP is represented by blue triangles,Cy5-SS-dGTP by red diamonds, and Cy5-SS-dUTP by yellow circles. All fluorescent values are normalized to the incorporated fluorescent signal observed when the extension reactions are performed with 100% reversibly dye labeled base (at 2 micromolar).
F. Linearity and Multiple Nucleotide Incorporations.
To determine if we could attain a linear fluorescence response by using a mixture of fluorescent and natural nucleotides, we used the synthetic oligonucleotide T6 as a template for polony amplification. We denatured the polonies, hybridized to a Cy3-labeled sequencing primer, and trapped the polymerase onto the immobilized primer:template duplex. We then performed serial base additions with the Cy5-dATP, Cy5-dCTP, Cy5-dGTP, and Alexa 488-dUTPs according to the protocol outlined in Fig. 1b on the main text. Each fluorescent analogue was mixed with the corresponding natural nucleotide so that, on average, 1 in 25 of every nucleotide incorporated was fluorescent. The nucleotide analogues used here did not have a reversible linker, so the change in fluorescent signal was measured after each base addition. The results are shown in Figure S7 below. For this template, the added fluorescence signal was linear with the number of incorporated bases, both for multiple incorporations of the same base (e.g. base "T" at the third addition step) and also for incorporations of different bases (because here the fluorophore was not removed after any cycle, yet the signal remained linear). However, different template sequences did not yield a linear response, indicating that sequence context can affect linearity (data not shown).

Figure S7. Linearity and Multiple Nucleotide Incorporations. The X-axis indicates sequential base addition (without cleaving). The Y-axis indicates the increase in fluorescence at each step. Approximately linear relationships in signal are observed for mononucleotide vs. dinucleotide incorporations (e.g. C vs. CC and T vs. TT), as well as for incorporations of different bases (e.g. C vs. G).
G.
Primers & Template Sequences
Template
OT1
Template
OT2
Template
OT3
Template
OT4
Template
LC1
Template
T1
Template
T2
Template
T3
Template
T4
Template
T5
Template T6 5' - cca cta cgc ctc cgc ttt cct ctc aaa gaa cat gtg agc aaa agg cca gca aaa ggc cag gaa ccg taa aaa ggc aga gaa tga gga acc cgg ggc ag - 3'.
The
PCR amplification and sequencing primers used in this work are listed here:
Primer
Seq1
Primer PR1-Fac 5' - Qcca cta cgc ctc cgc ttt cct ctc - 3'.
Primer
PR1-R
Primer T6-Seq 5' - ctg ccc cgg gtt cct cat tct - 3'.
PR1-R was used as both an amplification primer and a sequencing primer.
Occasionally we observe polonies that were not amplified from DNA template molecules, but were instead amplified from a primer-dimer event (e.g. Fig. 3). Typically, these primer-dimer polonies exhibit a lower fluorescence intensity than polonies amplified from template molecules. Furthermore, primer-dimer polonies tend to be larger than polonies amplified from DNA template. Since primer-dimer polonies are typically 1 to 3mm in diameter, they can be verified by picking the polony with a toothpick and sequencing the product (Mitra et al. 1999). However, we find that by designing primers that contain two or more “As” at the 3’ end (Kang et al. Nucleic Acids Res 2000 Jan 15;28(2):e2) or by using a sequencing primer which is nested inside of the two amplification primers (as was done for the experiment shown in Fig. 5) we can effectively eliminate primer-dimers from our sequencing images.
We provide here open-source code for polony image analysis, on the condition that all modifications of the code be made open-source and readily available as well. The current set of scripts are M files (MATLAB) and make extensive use of the Image Processing Toolbox functions. We are currently in the process of converting several of the scripts to C++ to improve speed.
We have yet to seriously generalize the routines. Consequently, many of the below programs were developed for specific sets of polony images. Protocols and parameters are constantly changing, so we often make minor modifications or improvements when analyzing new sets of images. Users may need to do the same in analyzing their own images. This document is intended to illustrate the general principles behind our analysis, and will provide users with a sense of how various commands can be utilized for efficient image analysis. Links to the scripts used in the analysis performed here are provided below.
Here we focus on the analysis of ten serial scans of a single slide on which a short read-length was sequenced via the polony method (Fig. 4B of manuscript). Ten cycles of single-base-extension were performed on a single acrylamide gel in which multiple polonies derived from five unique templates were present. A scan was performed after each single-base-extension step. In each scan, data is acquired on two channels, Cy3 (532 nM) and Cy5 (635 nM). The universal sequencing primer in this experiment was labeled with Cy3, whereas the nucleotides being added at each single-base-extension step were labeled with Cy5.
AUTOMATED IMAGE ALIGNMENT (PolCall)
Even with a defined protocol on a scanning instrument, the precise positioning of a given slide can vary appreciably from scan to scan. For our analysis, it is critical that scans be of the same dimension and precisely aligned to one another, such that a given set of pixel coordinates corresponds to precisely the same coordinates on different scans of the same gel. On gels, there exist defects that persist from scan to scan and often take the form of saturated or near-saturated pixels. We took advantage of these consistent defects to perform image alignment. A single scan was selected as a ‘reference’ to which all other images of the same slide could be aligned. Data from only a single channel was considered; in this case, the 532 nm channel was selected as it appeared to contain a greater amount of noise. A series of potential X-Y offsets (relative to the fixed reference scan) was considered for each scan being aligned. The number of individual pixel coordinates that were saturated or near-saturated in both the reference scan and the scan under consideration was calculated for each potential offset. This number is subsequently referred to as the “coincidence score”. To save computational time, the alignment algorithm considered only a 200x200 region of each image (at the upper-left corner) and restricted potential offsets to ± 50 pixels along each axis. In testing the algorithm, we worked with more than just the ten scans that are the primary focus of this analysis. We attempted to two sets of images, one consisting of 20 scans of a single slide and the other of 27 scans of a different slide. Run-time with these parameters was on the order of ~2 minutes per scan-alignment, and was unambiguously successful for 38/47 of the slides, resulting in a clear and strong peak in the value of the coincidence score at a specific offset. Selecting a somewhat more internal 200x200 block (e.g. not at the edge) resulted in unambiguous alignment of 7 more of the slides. It is very likely that 45 of the 47 slides could have been captured immediately, had an internal 200x200 grid been selected from the beginning of the analysis. The final two slides warranted manual double-checking (due to lower peak scores), but appeared to have been correctly aligned by the latter approach as well.
Example of Pre-Alignment Offset Matrix:
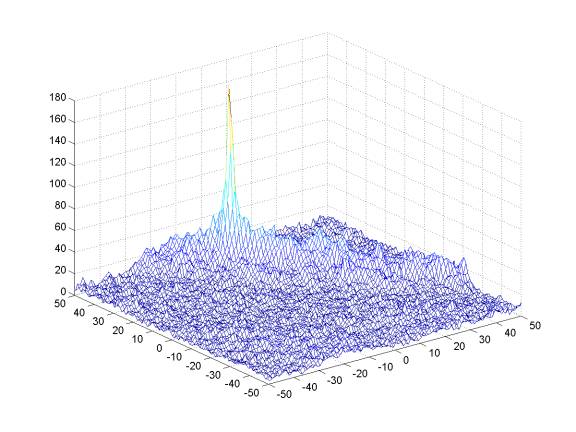
The X-axis and Y-axis represent potential offsets of the test slide relative to the reference slide. The Z-axis represents the coincidence score. Note the presence of a strong peak that is not centered.
After the peak is defined, it is straight-forward to realign the scan under consideration such that it is in register with the reference scan.
Offset Matrix for the same slide, but Post-Alignment:
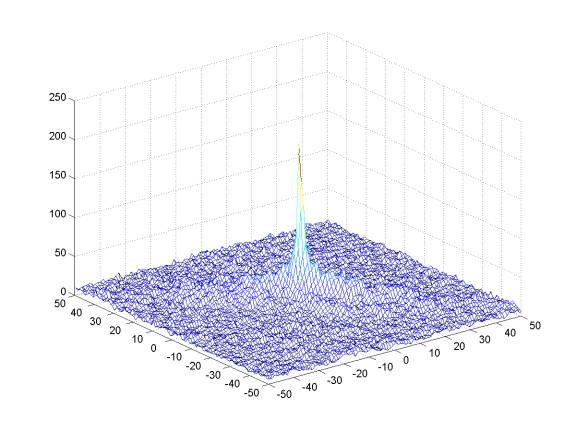
The X-axis and Y-axis represent potential offsets of the test slide relative to the reference slide. The Z-axis again represents the score at each potential offset with respect to coincident-near-saturated pixels. Note that the strong peak has been centered.
A total of 47 alignments were performed. A plot of the suggested offsets for individual slides is as follows:
The original set of scans were adjusted by the specified amounts, adjusted to maximum contrast, and resaved. 635 nm scans were adjusted by the same offsets as their 532 nm counterparts. With these images, each pixel corresponds to a 10 micron square.
Note the restricted portion of the landscape in which offsets tend to occur. In the future, computational time for image-alignment can be further reduced by limiting analysis of potential offsets to a narrow corridor along a single axis.
The range of offsets observed appears to vary with the type of scanner used (as one might expect, as it depends on the precision of engineering of the instrument). The data discussed here was collected with an Axon instrument. Anecdotally, we have observed that the offsets with a Perkin Elmer ScanArray instrument are much lower (generally less than 5 pixels along each axis).
We are rewriting the algorithms in C++ for speed optimization.
The next step is to identify the locations on the gel at which we predict, based on signal intensities, that single-base-extension has occurred. Note that in this section of the analysis, all calculations were performed on a single pixel-by-pixel basis. In other words, no matrix-based smoothing or other operations that rely on multiple pixels was performed. To save computational time, we focused on a 1000 x 1000 polony-rich subsection of the slide. Pixel intensity values are integers ranging from 0 to 65535.
Obviously, not all pixels on the image contribute to polonies. The set of background pixels can be thought of as including both those pixels that lie in the low-intensity areas between polonies, as well as those pixels that are at the fringes of a polony. The 532 nm channel tells us where the polonies are by virtue of the Cy3 labeled sequencing primer. In this analysis, all pixels whose intensity value on the 532 nm channel was less than 40,000 in all 10 scans were excluded from consideration.
The Cy3 channel data essentially provides consistent information on the location of polonies, and serves as an internal control against which base addition or failure of addition at a given step of single-base-extension can be measured. We will term the [532 nm / 635 nm] ratio, above which we consider a base to have been successfully added, to be the “discriminating ratio”. A ratio-image is essentially a matrix consisting of the 532 nm scan intensities divided by the 635 nm scan intensities. Selection of an appropriate discriminating ratio was based on manual inspection of the images. For all A, C and T additions, we used a discriminating ratio of 0.385, and for all G additions we used an adjusted discriminating ratio of 0.320. It was noticed that Cy5-SS-dGTP additions consistently gave rise to a lower signal intensity than the other modified nucleotides, and thus required a lower discriminating ratio.
The following plots are representative of how 'thresholding' of images proceeded. The upper set of four plots was generated using the 3rd scan set (which corresponds to the third panel of Figure 5A), and the lower set of four plots was generated using the fourth scan set (which corresponds to the fourth panel of Figure 5A). The Cy3 and Cy5 images are independently contrast-adjusted, and the two thresholds described above, namely a Cy3 value of greater than 40,000 and a Cy5/Cy3 value that is above the discriminating ratio. The upper-left plots are X-Y plots of of the Cy3 intensities (y-axis) and Cy5 intensities (x-axis) of individual pixels. The red-lines depict the locations of the cutoffs defined by the two thresholds. The upper-right plot is a heat-map of Cy5 intensities, and the lower-right plot is a heat-map of Cy3 intensities. The lower-left plot indicates which pixels (in white) met the cutoffs set by the two thresholds. These are the pixels that would be marked as 'on' in the subsequent signature extraction.
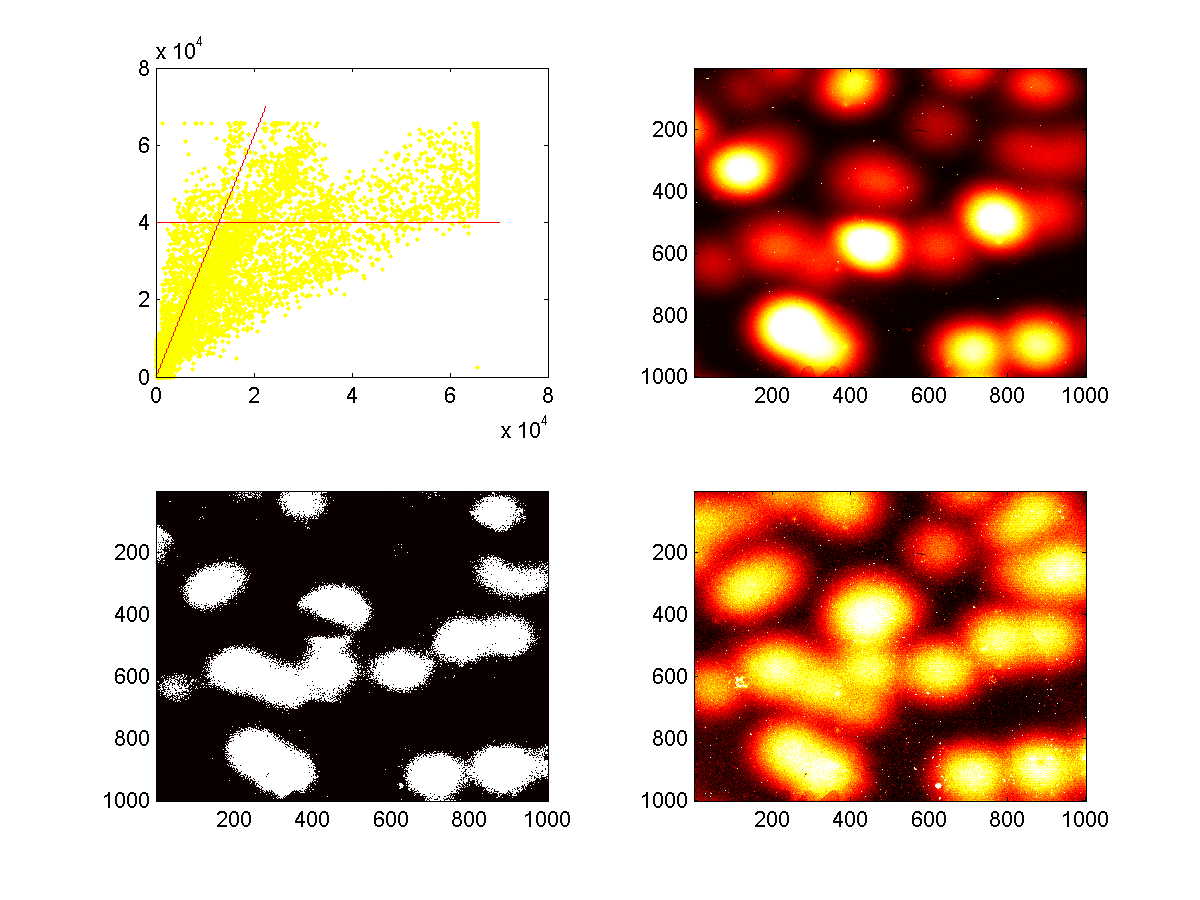
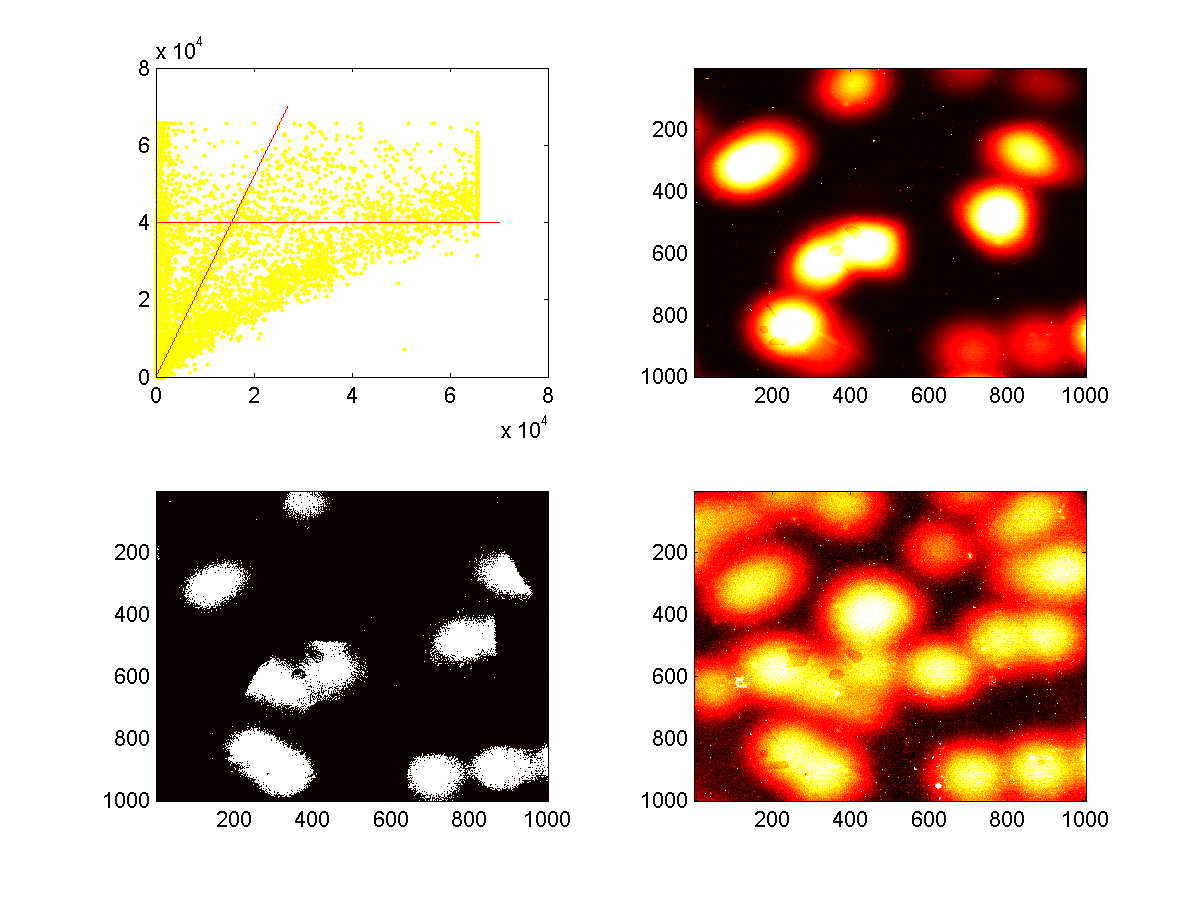
The polonies tend to fall into one of three categories, 'weak adders', 'strong adders', and 'no adders'. The distinction between strong and weak adders appears to be a systematic effect, perhaps due to sequence-context dependence, as multiple polonies derived from the same template always give rise to consistently weak or strong addition. Nevertheless, the distinction between weak-adders and no-adders is quite clear. For all polonies derived from any given template, the relationship between the Cy5 and Cy3 levels appears to be quite linear (above figures, data not shown)
PIXEL-BY-PIXEL SEQUENCE SIGNATURE EXTRACTION (PolCall)
Moving on to signature determination, A pixel signature is a binary string, where each digit position is reserved for a given scan. The signature extraction algorithm functions as follows:
(1) Generate ratio-image for a given scan. (2) Convert to binary-image based on a fixed discriminating ratio (e.g. 1 where base added, 0 where base did not) (3) Append value to binary-string-image (4) Go To Step (1) for all relevant images (in order of scans). (5) Convert binary-strings to sequences based on knowledge of base-addition order
The signature matrix was generated in MATLAB and exported to PERL for decoding of base 10 values into base 2 bit-strings. Time to generate signatures was on the order of minutes, and is directly proportional to the number of images under analysis.
In this experiment, the following five templates were amplified:
ST20 Primer - CACACACACACACACTC
ST21 Primer - GTGTGTGTGTGTGTGTC
ST23 Primer - CAGCCGAACGACCGATC
ST29 Primer - ATGTGAGAGCTGTCGTC
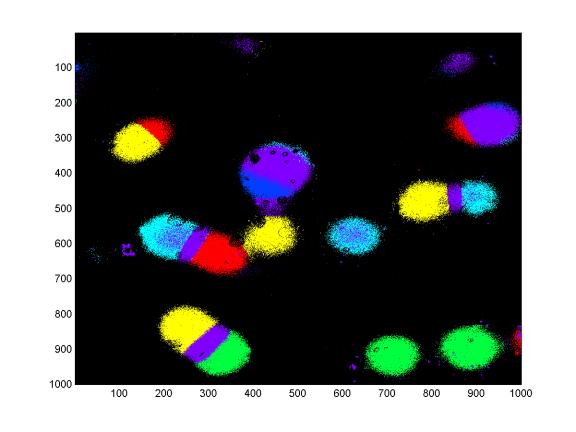
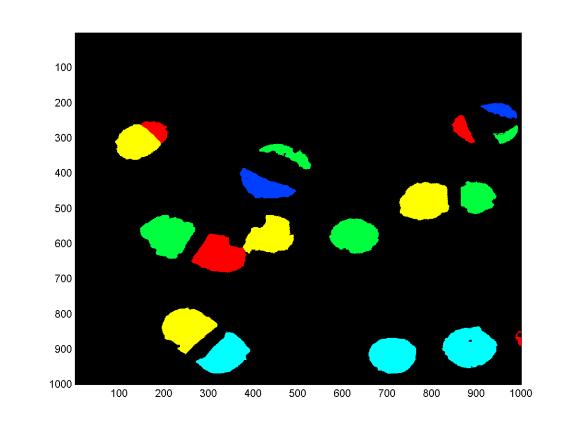
ST30 Primer – AGTGCTCACACACGTGATC After taking into account systematic errors (discussed below), the five most common “pixel signatures” corresponded to these five templates. The following image depicts the 1000 x 1000 area under consideration. Pixels yielding signatures corresponding to one of the five above templates have been given unique colors, whereas all “noise” pixels (those corresponding to unrecognized signatures) are colored purple. The key below the image summarizes the templates to which each color corresponds, the true sequences, and the observed signatures. Black pixels are those whose intensity fell below the threshold of 40,000 across all aligned & normalized Cy3 scans.
![]()
If you know that the base addition order was in this experiment was CAGTCAGTCA (ten bases), then the translation from bit signatures to a sequence read is quite straightforward. It appears that the vast majority of incorrect signatures are to be found at pixels in one of two places. First, note the bands of blue found at the junction of adjacent polonies with differing signatures. Second, note the small but substantial numbers of blue pixels mixed into the green polonies, seemingly reflecting an error that appears to be specific to pixels deriving from that template.
Future work can be directed at identifying and eliminating these forms of random error on a pixel-by-pixel basis (or something close to it).
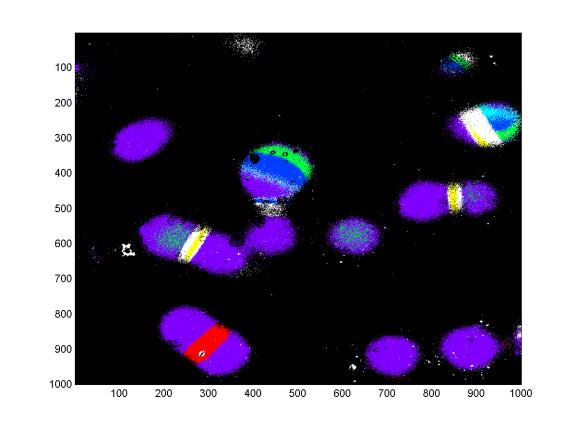
There are two systematic errors that are consistent with those observed by Rob Mitra when sequencing these template. The first is the the apparent insertion of a G at the second position of the ST29-like sequence. The second is the recognition of the “CC” stretch in ST23 as a single “C”. We have yet to fully define the nature of the former error, but it is consistently observed with this template. The latter error is fully expected, given that non-terminating nucleotides were used in this protocol. Given that these are systematic errors, we will consider the ST29-like and ST23-like sequences to be “correct” in the context of our analysis of random error. What exactly is the noise? In this figure, the five most common noise species (e.g. signatures) have been given unique colors, whereas correct template calls are colored purple. Minor noise signatures species (not in the top five) are colored white. We observe that characteristic noise types occur systematically at the intersection of specific pair-wise combinations of polonies.
An analysis of the common noise-types (GMC) found that they were generally very consistent with a logical OR function of the signatures of the intersecting polonies, as one might expect. A summary of that analysis is as follows:
POLONY SIGNATURE OBJECT FINDING (PolCall)
In this section we’ll move away from the worrying about individual pixels and instead worry about how to distinguish multi-pixel polonies from one another, but more importantly how to distinguish real signatures from noise in the form of randomly scattered noise pixels as well as erroneous signatures that occur at the junction of closely neighboring polonies. Finding individual polonies on a crowded slide is a difficult task, as the intensity peaks of “touching” polonies do not always appear to be clearly distinguishable. An alternative approach to finding and scoring individual polonies is to start from the single-pixel-signature analysis, and to ask whether objects can be defined as clusters of adjacent pixels that share a common signature. Looking at the above picture, it is quite clear that this should be possible, especially after some image smoothing (or “signature smoothing”) has been performed. We’ll then be faced with the task of distinguishing “real signature objects” from “noise signature objects”, as we have observed that clusters of pixels with identical noise signatures occur quite commonly. One distinguishing characteristic of ‘noise signature objects’ may be that their perimeter may tend to be surrounded by pixels of a different signature, as they most often occur as a consequence of the adjacency of two real polonies. Another distinguishing characteristic is that mixed-polony signatures tend to have higher parities than real polony signatures. We’ll attempt to filter out ‘noise signature objects’ on the basis of these characteristics. The algorithm consists of just a few steps:
(1) Signature Mode Filtering.
A smoothing operation, similar to median filtering. For each location in the image, the most frequently occurring signature (e.g. the mode) in the 10x10 matrix surrounding it is selected as its new value.
(2) Object Finding
An object is a fully connected set of at least N pixels with a single signature value. In this example, an object was required to contain at least 400 pixels.
(3) Perimeter & Parity Scoring
For each object, find the set of non-object pixels that are adjacent to object pixels. Calculate the fraction of perimeter pixels that have assigned signatures. Report objects that have high fractions of “free” perimeter pixels. In this example, the minimum fraction of free perimeter pixels to qualify for reporting was set to 0.30. The maximum allowable parity was 10 (excluding ‘objects’ that added on every single-base-extension; usually these are clumps of high-intensity noise) The following image is the same region of the gel as shown above, after signature mode filtering, object finding, and perimeter & parity-based image processing.
The analysis is successful in that 18 out of 18 polony objects are correctly called as one of the five known template sequences (with no mistakes excepting the known systematic errors on one template that are discussed above).
SOURCE CODE FOR SOFTWARE (PolCall)
These scripts have not been generalized. We are providing them here to demonstrate how the image analysis proceeds.
SatAlignAll.m Handles multiple image alignment
SatAlign.m Handles single image alignment (called by SatAlignAll.m)
SigProcess.m Determines pixel-by-pixel sequence signatures
ObjectFinder.m Finds signature objects that meet specified criteria
ModeFilter.m Performs a matrix-based signature mode operation on an image (called by ObjectFinder.m)
ModeFind.m Performs signature mode-finding on a sub-matrix (called by ModeFilter.m)
RunAll.m RunAll.m (runs all of the above scripts in concert)
The below estimates (summary and detailed documents) were prepared in Fall 2002. We have since generated an updated cost model (Summer 2003) with a greater detail and presenting a range of potential scenarios.
Summary of Cost Analysis
Raw data rate:
25 pixels/bp, 1Mpixel per 6sec/CPU = 24 CPU days.
Amortization:
5 years, 80% duty cycle, 12.5 minutes/cycle =
$3433 per 6.9x10¹⁰
bp
Overhead:
$200 /sq ft/yr * 60 sq.ft
(600 cu.ft) = $42
Reagents:
At
20 microliters/cycle 200
bases/slide = $979
Library
Preparation:
(includes
DNA preparation) $28
Electricity:
2 kwatts 24hr*17days* 0.13$/kwatt-hr = $104
Labor
for repair:
10%
of instrument cost = $343
Labor
for operation:
Slide
PCR, slide dips, scans, etc. = $499
Total:
$5428 per Diploid Genome (11x
or >99.99 coverage) or 7.9 cents per
Megabase
Detailed
Cost Summary (Word Document)
Detailed
Cost Summary (Excel Spreadsheet)
Roach Curves for Estimated Coverage Requirements for De Novo FISSEQ
We
envision polony sequencing as a useful tool for resequencing genomes,
particularly the human genome. However,
we believe that this technology will also be useful for the de novo sequencing
of genomes. Figure S8 below plots the
relationship between sequence coverage and probability of closure for the
Mycoplasma pneumoniae genome (816,394 bp), assuming 34 base pair reads. This curve is based on the analysis presented by Roach (Genome
Res 1995 Dec;5(5):464-73).
To sequence genomes with long repeats (e.g. human or mouse genome) a
mated pair strategy will be used in which we sequence 30-100 base pairs from
each end of a long (5-15kb) amplicon. Figures
S9 and S10 show the degree coverage needed to assemble de novo the human genome
assuming a 34 base read length (Figure S9) and a 200 base read length (Figure
S10). Note that these estimates
take neither genomic
repeats nor information from a mated-pair strategy into account.
Here is a link to an Internet physical mapping calculator.
Here is a link to the spreadsheet data (Excel) with which the below Roach curves were generated.
Figure S8. Roach Curve for De Novo Sequencing of Mycoplasma pneumoniae Assuming 34 bp Read Lengths
Figure S9. Roach Curve for De Novo Sequencing of Homo sapiens Assuming 34 bp Read Lengths
Figure S10. Roach Curve for De Novo Sequencing of Homo sapiens Assuming 500 bp Read Lengths
We
have established a separate website describing the latest in polony protocol
development for various applications:
1. We inadvertently omitted the following acknowledgement in our paper: We are grateful to Phil Buzby and his group at PerkinElmer for making the Cy5-SS-dNTPs used in this study.
2. The following information should have appeared in the main text (under Methods) rather than where it appeared in our supplementary information:
The Cy5-SS-dNTPs were synthesized at PerkinElmer Life and Analytical Sciences, Inc. (Boston, MA). These reagents can be obtained by contacting their custom synthesis department. Cy5-PC-dUTP was synthesized at Ambergen (Boston, MA).