Complex
Homogeneity
|
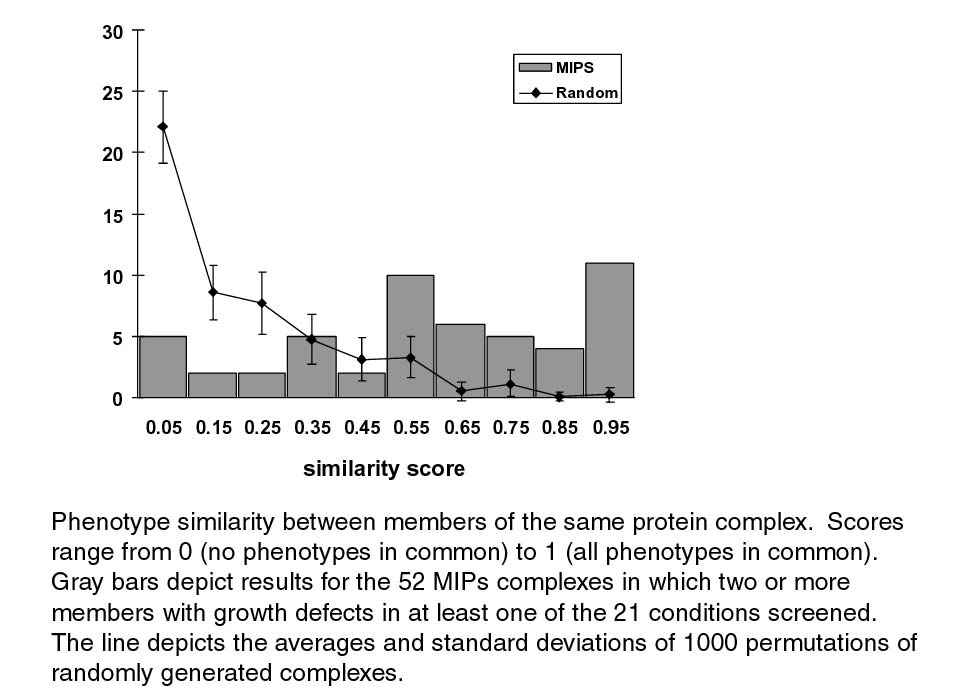
We developed a simple measure of phenotype
similarity between members of the same protein complex. Briefly, we represent
the similarity of phenotypes by calculating the average distance between the phenotype
profiles of all pairs of subunits within that complex. Results for the 52 MIPS
complexes with two or more members displaying phenotypes in our data set
demonstrate that complexes span the range of similarity from homogeneous to
heterogeneous, with a third of the complexes scoring in the range of greater
phenotype dissimilarity (score <0.5) and two thirds scoring in the range
of greater phenotype similarity (score >0.5) (homograph.jpg). These results are in sharp
contrast to a randomly generated distribution, which is biased towards
greater phenotypic heterogeneity. Thus,
well characterized multi-protein complexes display a range of phenotype
similarities between their members, suggesting that some complexes consist of
subunits that carryout a small set of functions required under the same set
of conditions, while others contain a number of distinct functions required
under more varied combinations of conditions. |
|
Detailed methods for calculation of complex homogeneity. |
|
|
|
|
|
Graph depicting the phenotype similarity between members of the same protein complex, as compared to random. |
|
|
|
|
|
Defines the heterogeneity of a complex by finding the average similarity between all pairwise phenotype profiles in a complex. |
|
|
|
|
|
Use the complexes as defined in ComplxHetero.pl. Shuffle the phenotype profiles to generate 1000 random sets of complexes. |
|
|
|
|
|
Input and output data files for ComplxHetero.pl. The 1000 randoms sets are not included, those may be generated using Reorganize.pl |
|
|
|
|
|
Homogeneity graph for Gavin complexes. |