Fluorescent
in situ Sequencing on Polymerase
Colonies
Robi
D. Mitra1, Jay Shendure1, Jerzy Olejnik2, and
George M. Church1*
1Lipper
Center for Computational Genetics and Department of Genetics, Harvard Medical
School, 200 Longwood Ave., Boston, MA 02115.
2AmberGen,
Inc. 1106 Commonwealth Ave, Boston,
MA 02215.
*Corresponding
author: church@arep.med.harvard.edu
F.
Linearity and Multiple Nucleotide IncorporationsTo
ascertain how long DNA polymerase remains trapped on DNA within a polony, we
trapped Klenow polymerase onto a polony template and washed the slide in a large
volume of low salt buffer with shaking for seventy-two hours.
After washing, a fluorescent nucleotide extension reaction was performed
without adding additional DNA polymerase. The
incorporated fluorescence was approximately the same as when the washing step
was omitted (figure S1), indicating that the DNA polymerase remains bound to the
DNA for at least 72 hours.
B.
Sulfhydryl-cleavable
Deoxynucleotide Analogue Structures & Synthesis
We
designed structures of sulfydryl-cleavable deoxynucleotide analogues, and had the
molecules custom-synthesized (Perkin Elmer / NEN).
The structures are presented in the main paper (figure 4a)
and below (figure S2). Details of
the synthesis and the nucleotide analogues themselves are available from Perkin
Elmer / NEN.
Figure
S2. Structures of
sulfhydryl-cleavable deoxynucleotide analogues.
The structure of Cy5-SS-dCTP is presented in the main body of the
manuscript.
C. Synthesis of Photocleavable Fluorophore Deoxyuridine Triphosphate Conjugates
Two compounds were
synthesized, BODIPY-FL-PC-dUTP and Cy5-PC-dUTP. The synthesis scheme is
presented in Figure S3.
BODIPY-FL-PC-dUTP
Compound 5
(0.23 µmol) was dissolved in 100 µl of 50 mM NaHCO3 and then 73 µl
(8 eqs.) of BODIPY-FL-SE (25 mM solution in DMF, Molecular Probes) was added.
Reaction mixture was incubated for 2 hrs at room temperature and the product
isolated using RP-HPLC as described above. Fractions containing the desired
product were pooled and freeze-dried to give 36 nmoles of compound 6
(based on BODIPY-FL fluorophore absorption, Absorption max = 505 nm, e
= 80,000).
Cy5-PC-dUTP
Compound 5 (0.24 µmol) was dissolved in 40 µl of 50 mM NaHCO3 and then 0.72 µmol of Cy5 – monoreactive NHS (Amersham-Pharmacia) in 100 µl of DMF was added. Reaction mixture was incubated for 2 hrs at room temperature and the product isolated using RP-HPLC initially on R2/10 RP column (Perseptive Biosystems, 4.6x100 mm) followed by another purification on NovaPak C18, (Waters, 10 x 100 mm). In both case a gradient (0-90%) of acetonitrile in 50 mM triethylammonium acetate (pH 4.5) over 45 minutes with flow rate 1 ml/min. was used. Fractions containing the desired product were identified by performing photocleavage followed by analytical HPLC, pooled and freeze-dried to give 60.5 nmoles of compound 7 (based on Cy5 fluorophore 550 nm absorption maximum, e = 250,000). We were unable to purify this conjugate to homogeneity, even though two different reverse phase HPLC separations were performed. The preparation was used for polony sequencing experiments – the estimated purity was ~50% based on the extent of the conversion of conjugate to the intermediate 5 upon irradiation (Figure S4). The impurity was determined to be the hydrolyzed Cy5-NHS reagent, which did not interfere with the subsequent polony sequencing reactions.
Figure S3. Scheme for synthesis of photoclevable fluorophore deoxyuridine triphosphate conjugates.
Figure S4. Photocleavage/HPLC analysis of BODIPY-FL-PC-dUTP and Cy5-PC-dUTP.
D.
Photo-cleavable Deoxynucleotide Analogue Structure, Cleavability & Extension Efficiencies
We
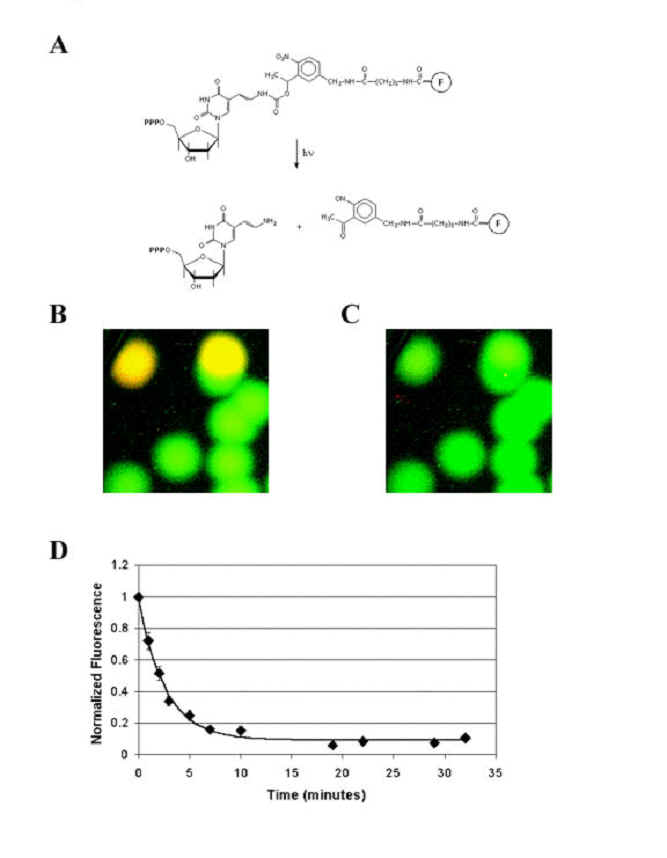
designed & synthesized a dUTP analogue, Cy5-PC-dUTP, with a photocleavable
linker between the nucleotide and the fluorophore (figure S3a).
To see if DNA polymerase would recognize this analogue, we
performed experiments identical to the ones described in Figure 4 of the main paper, except the extension was performed with the Cy5-PC-dUTP
nucleotide analogue, and light was used as the cleaving agent (figure S3b and
S3c). As expected, we see two types
of polonies, green and yellow, and by further base extensions it was confirmed
that the nucleotide was correctly incorporated.
To characterize the rate and extent the fluorescent signal can be removed
by exposure to light, we exposed the slide to 365 nm light, imaging the slide at
various intervals. After 29 minutes
of exposure, the fluorescence was greatly reduced, although not completely
removed (figure S3d). The
decay of the fluorescent signal can be fitted to an exponential curve that
decays with a time constant of 2.6 minutes to a steady state value equal to 7.5%
of the original fluorescence.
Figure
S3
E.
Titration of Reversibly Dye-labeled
Nucleotide Analogues and Natural Deoxynucleotides.
Because
fluorophores tend to "quench" one another when they are in close
proximity, we hypothesized that it might be advantageous to perform extension
with a mixture of unlabeled and labeled nucleotide, so that when repeated bases
occur in the sequence, multiple labeled nucleotides are unlikely to be
incorporated into adjacent positions in the growing DNA strand.
DNA polymerase incorporates natural nucleotides more efficiently than
fluorescent nucleotides, so we performed extension reactions with varying ratios
of fluorescent to natural nucleotides and quantified the amount of fluorescence
incorporated (figure S4). The
results indicate a linear relationship between the fraction of fluorescent
nucleotide present in the extension reaction and the normalized signal intensity
values.
Figure S4. Titration of natural and reversibly dye labeled nucleotides. Single base extension reactions were performed using 2 micromolar natural nucleotide and varying amounts of reversibly dye labeled nucleotide. The results are plotted above. The x-axis represents the fraction of total nucleotide concentration included in the extension reaction that is dye labeled. Cy5-SS-dATP is represented by green squares, Cy5-SS-dCTP is represented by blue triangles,Cy5-SS-dGTP by red diamonds, and Cy5-SS-dUTP by yellow circles. All fluorescent values are normalized to the incorporated fluorescent signal observed when the extension reactions are performed with 100% reversibly dye labeled base (at 2 micromolar).
F. Linearity and Multiple Nucleotide Incorporations.
To determine if we could attain a linear fluorescence response by using a mixture of fluorescent and natural nucleotides, we used the synthetic oligonucleotide T6 as a template for polony amplification. We denatured the polonies, hybridized to a Cy3-labeled sequencing primer, and trapped the polymerase onto the immobilized primer:template duplex. We then performed serial base additions with the Cy5-dATP, Cy5-dCTP, Cy5-dGTP, and Alexa 488-dUTPs according to the protocol outlined in Fig. 1b on the main text. Each fluorescent analogue was mixed with the corresponding natural nucleotide so that, on average, 1 in 25 of every nucleotide incorporated was fluorescent. The nucleotide analogues used here did not have a reversible linker, so the change in fluorescent signal was measured after each base addition. The results are shown in Figure S5 below. For this template, the added fluorescence signal was linear with the number of incorporated bases, both for multiple incorporations of the same base (e.g. base "T" at the third addition step) and also for incorporations of different bases (because here the fluorophore was not removed after any cycle, yet the signal remained linear). However, different template sequences did not yield a linear response, indicating that sequence context can affect linearity (data not shown).
Figure S5. Linearity and Multiple Nucleotide Incorporations. The X-axis indicates sequential base addition (without cleaving). The Y-axis indicates the increase in fluorescence at each step. Approximately linear relationships in signal are observed for mononucleotide vs. dinucleotide incorporations (e.g. C vs. CC and T vs. TT), as well as for incorporations of different bases (e.g. C vs. G).
G.
Primers & Template Sequences
Template
OT1
Template
OT2
Template
OT3
Template
OT4
Template
LC1
Template
T1
Template
T2
Template
T3
Template
T4
Template
T5
Template T6 5' - cca cta cgc ctc cgc ttt cct ctc aaa gaa cat gtg agc aaa agg cca gca aaa ggc cag gaa ccg taa aaa ggc aga gaa tga gga acc cgg ggc ag - 3'.
The
PCR amplification and sequencing primers used in this work are listed here:
Primer
Seq1
Primer PR1-Fac 5' - Qcca cta cgc ctc cgc ttt cct ctc - 3'.
Primer
PR1-R
Primer T6-Seq 5' - ctg ccc cgg gtt cct cat tct - 3'.
PR1-R was used as both an amplification primer and a sequencing primer.
We
have established a separate website describing the software in detail and
providing open source-code:
We have established a separate website
describing the latest in polony protocol development for various applications:
Summary
of Cost Analysis
Raw data rate:
25 pixels/bp, 1Mpixel per 6sec/CPU = 24 CPU days.
Amortization:
5 years, 80% duty cycle, 12.5 minutes/cycle =
$3433 per 6.9x10¹⁰
bp
Overhead:
$200 /sq ft/yr * 60 sq.ft
(600 cu.ft) = $42
Reagents:
At
20 microliters/cycle 200
bases/slide = $979
Library
Preparation:
(includes
DNA preparation) $28
Electricity:
2 kwatts 24hr*17days* 0.13$/kwatt-hr = $104
Labor
for repair:
10%
of instrument cost = $343
Labor
for operation:
Slide
PCR, slide dips, scans, etc. = $499
Total:
$5428 per Diploid Genome (11x
or >99.99 coverage) or 7.9 cents per
Megabase
White Paper on Polony Sequencing
Detailed
Cost Summary (Word Document)
Detailed
Cost Summary (Excel Spreadsheet)