1The Lipper Center for Computational Genetics, Department of Genetics, Harvard Medical School, Boston, Massachusetts, 02115, USA
2Department of Biological Chemistry and Molecular Pharmacology, 250 Longwood Avenue, Harvard Medical School, Boston, Massachusetts, 02115, USA
3Department of Biochemistry and Center of Excellence in Bioinformatics, SUNY at Buffalo, Buffalo, New York, 14214, USA
Correspondence should be addressed to GMC
Figure 1: Overview of PFR-Sampler and PFR-Searcher methods. a. PFR-Sampler overview. A set of co-regulated genes, together with the conserved sequence profiles (see Methods) for all genomic PFRs are input into PFR-Sampler, which identifies the set of PFRs surrounding the co-regulated genes, and identifies the subset with the most similar conserved word profiles that is also most distinct from background. b. PFR-Searcher overview. The training set of PFRs along with the PFRs to search are input into PFR-Searcher, which constructs a model from the training set, and reports a ranked list of the scanned PFRs according to similarity to the model. Abbreviation: PFR - phylogenetic footprint.
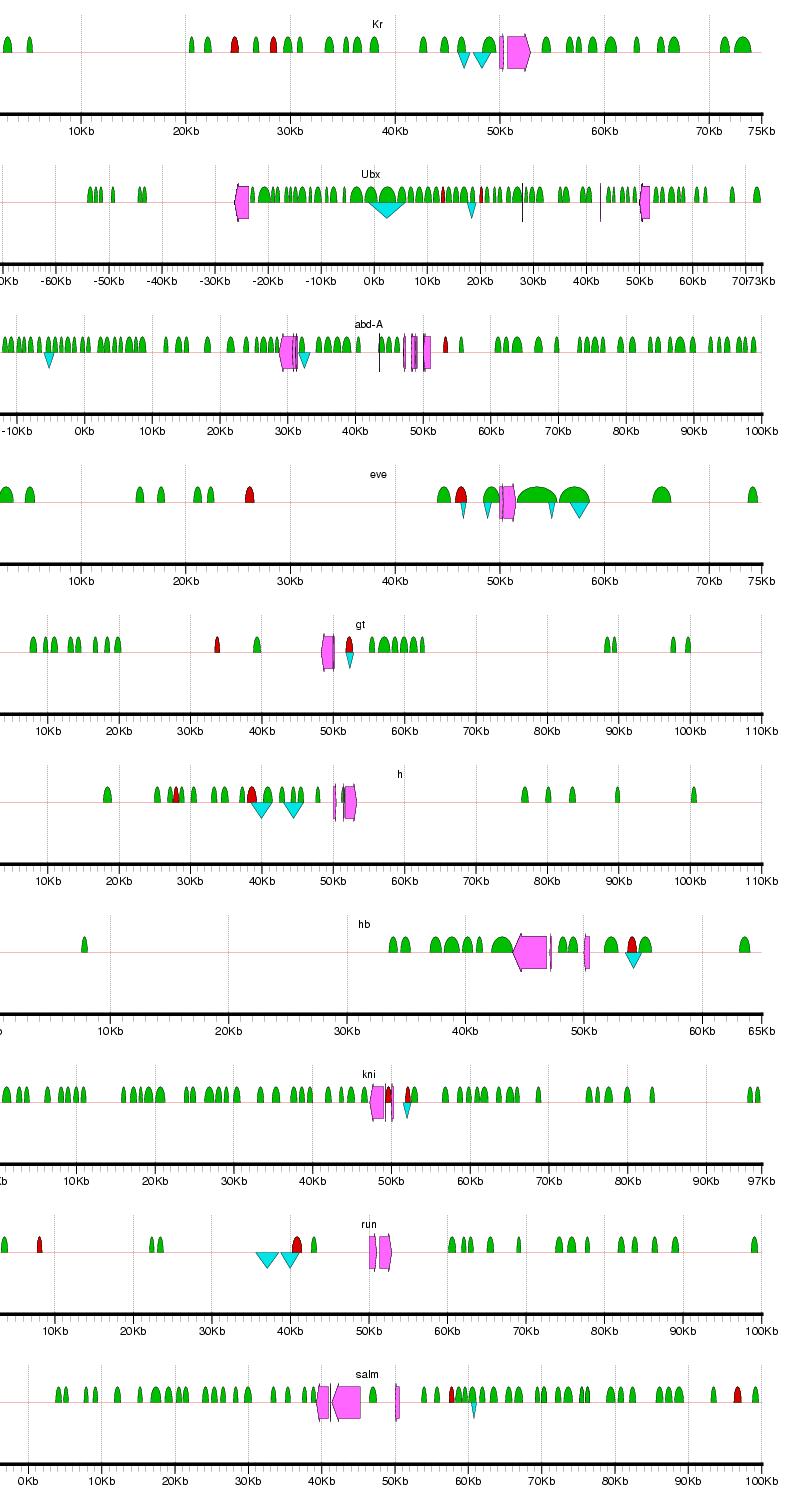
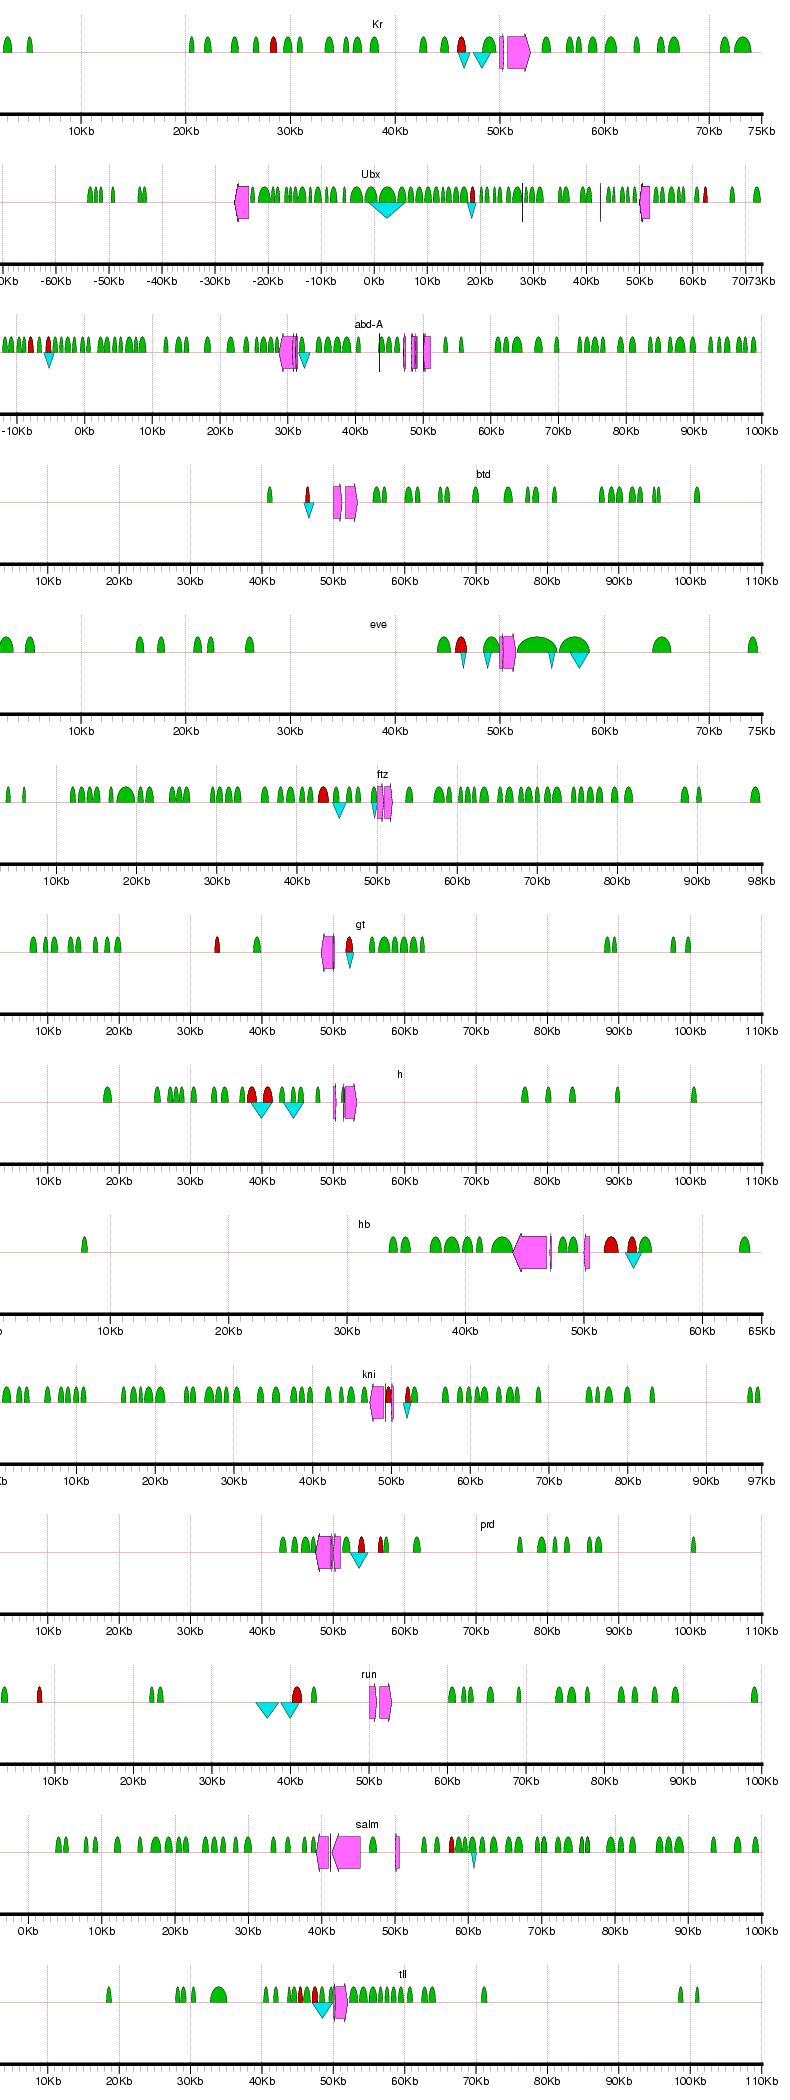
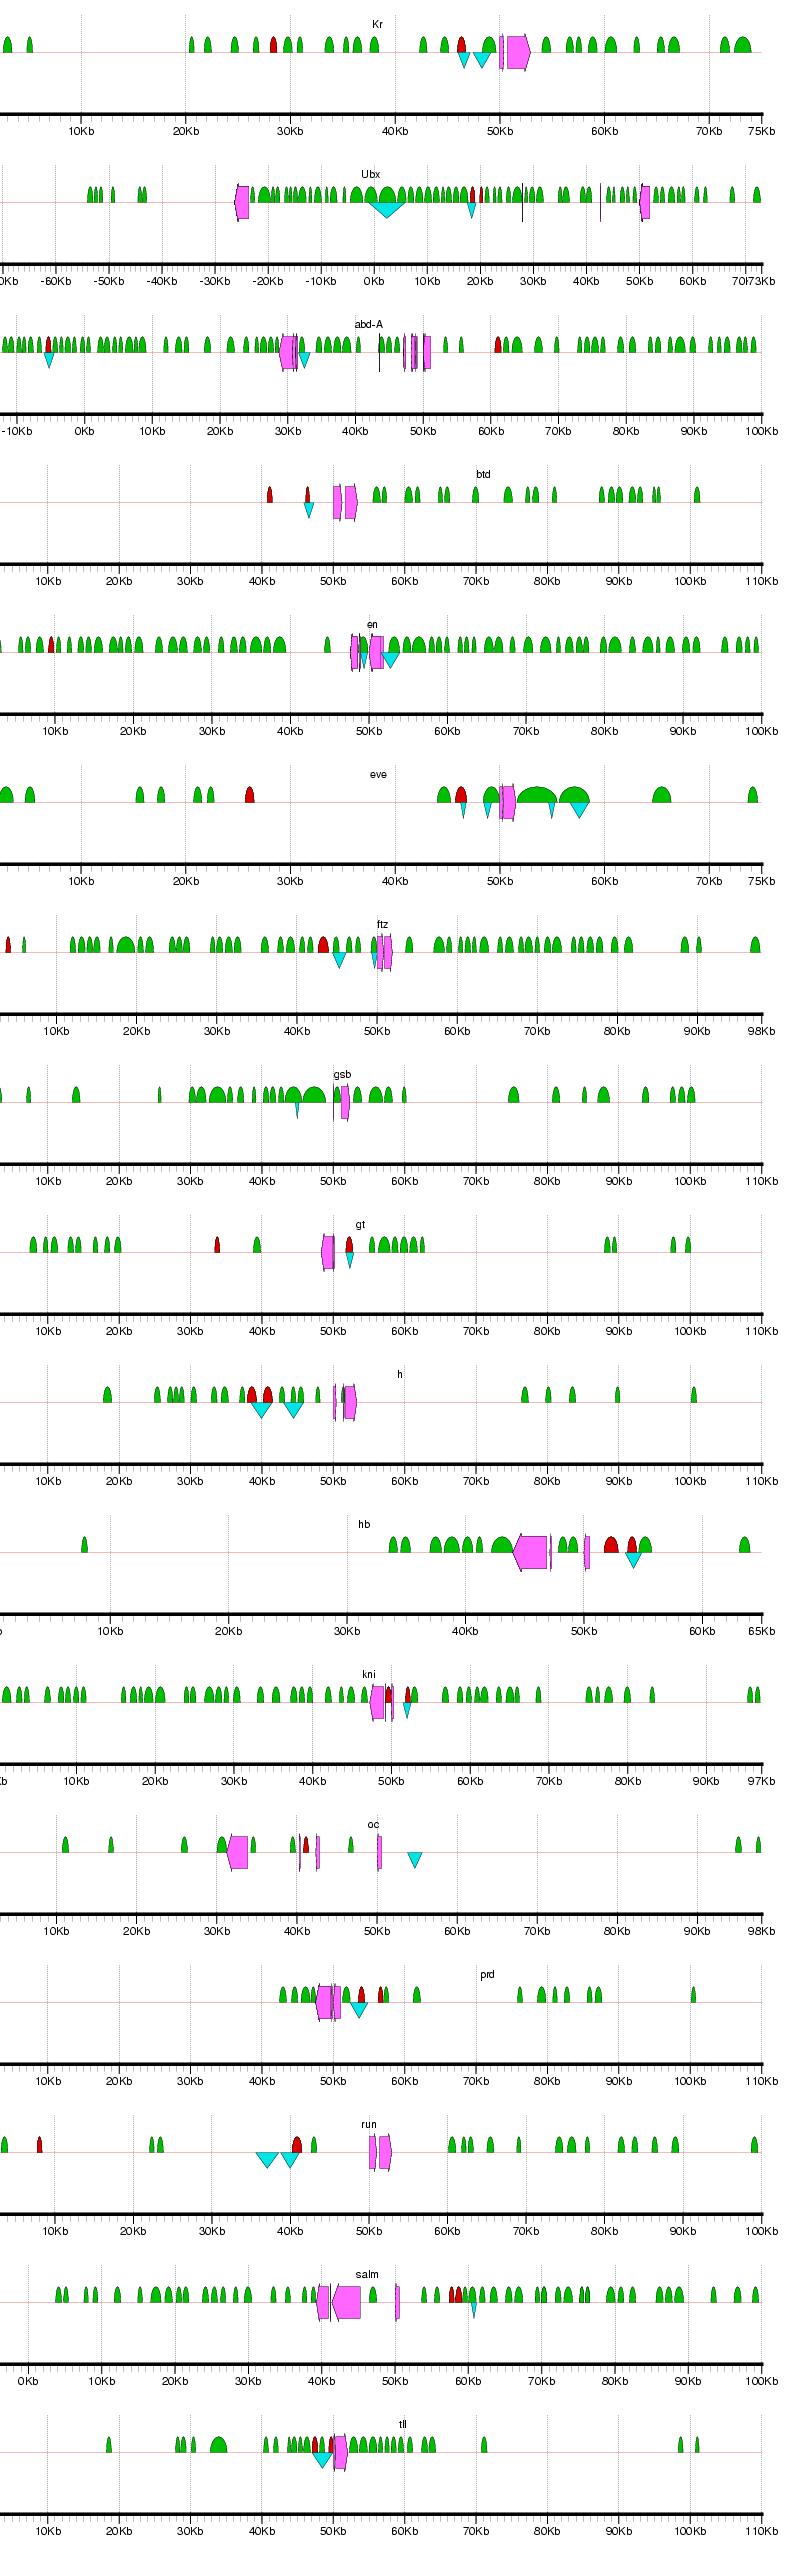
Figure 2: Examples of results from the phylogenetic footprinting procedure for loci surrounding 19 blastodermally expressed genes (Abbreviations: abdominal-A - abd-A; fushi tarazu - ftz; hunchback - hb; Kruppel -Kr; ultrabithorax - Ubx). The loci extend 50 kb flanking the start and stopping site of each gene, or to a midway point between two adjacent genes. Fuchsia arrows designate exons, blue triangles indicate known blastodermal enhancers, and green semicircles indicate PFRs. Figure generated using gff2ps (Abril and Guigo 2000). For full results, see Supplemental Figure 1.
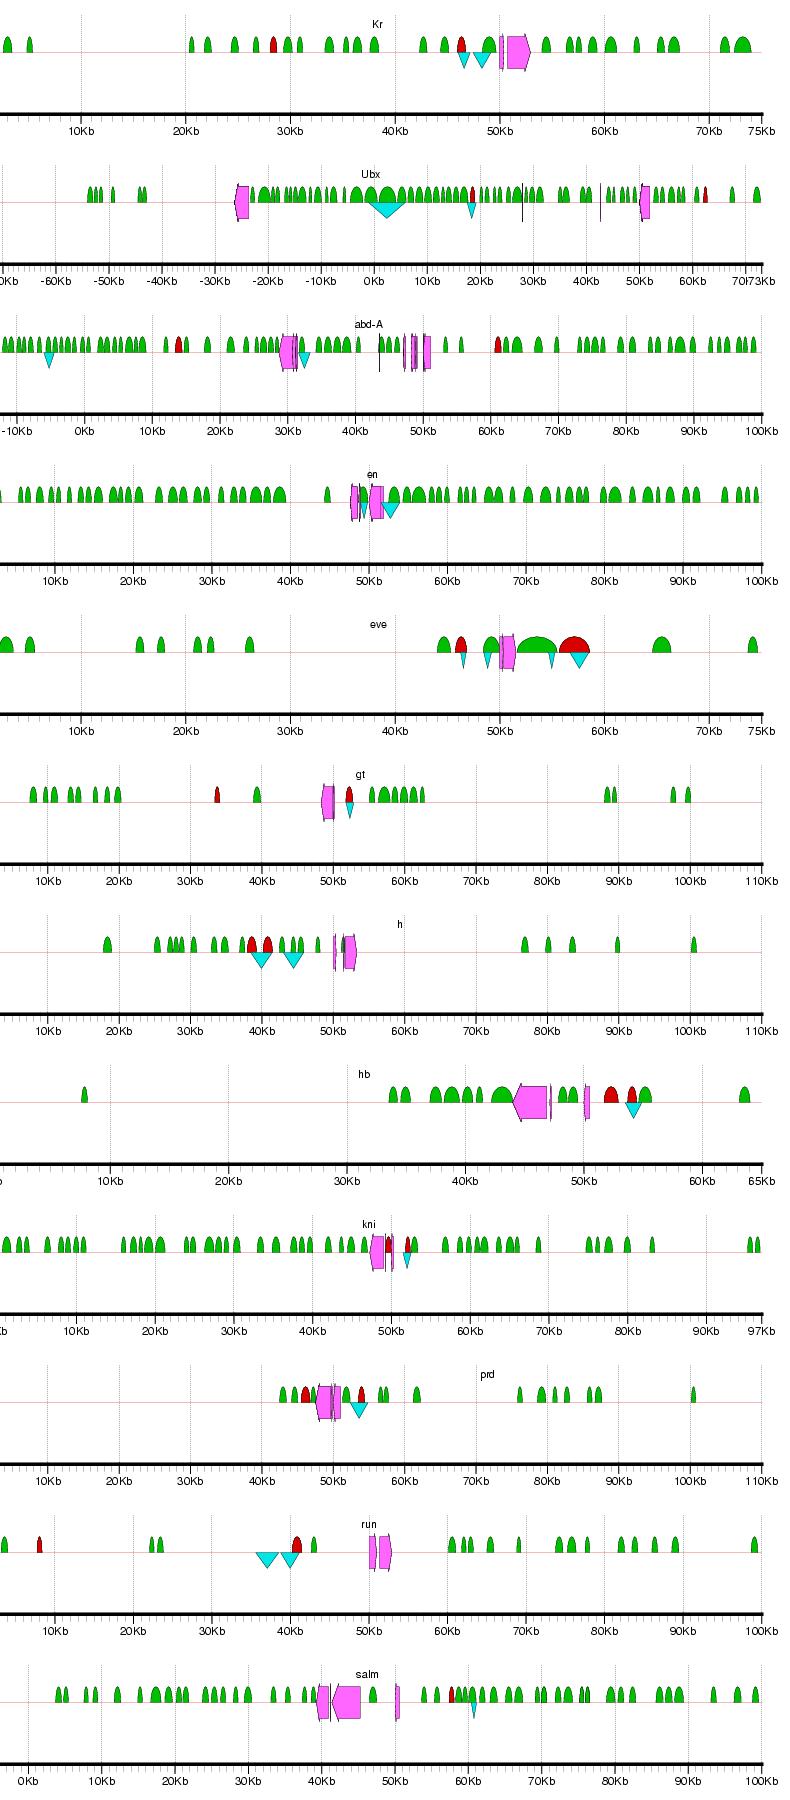
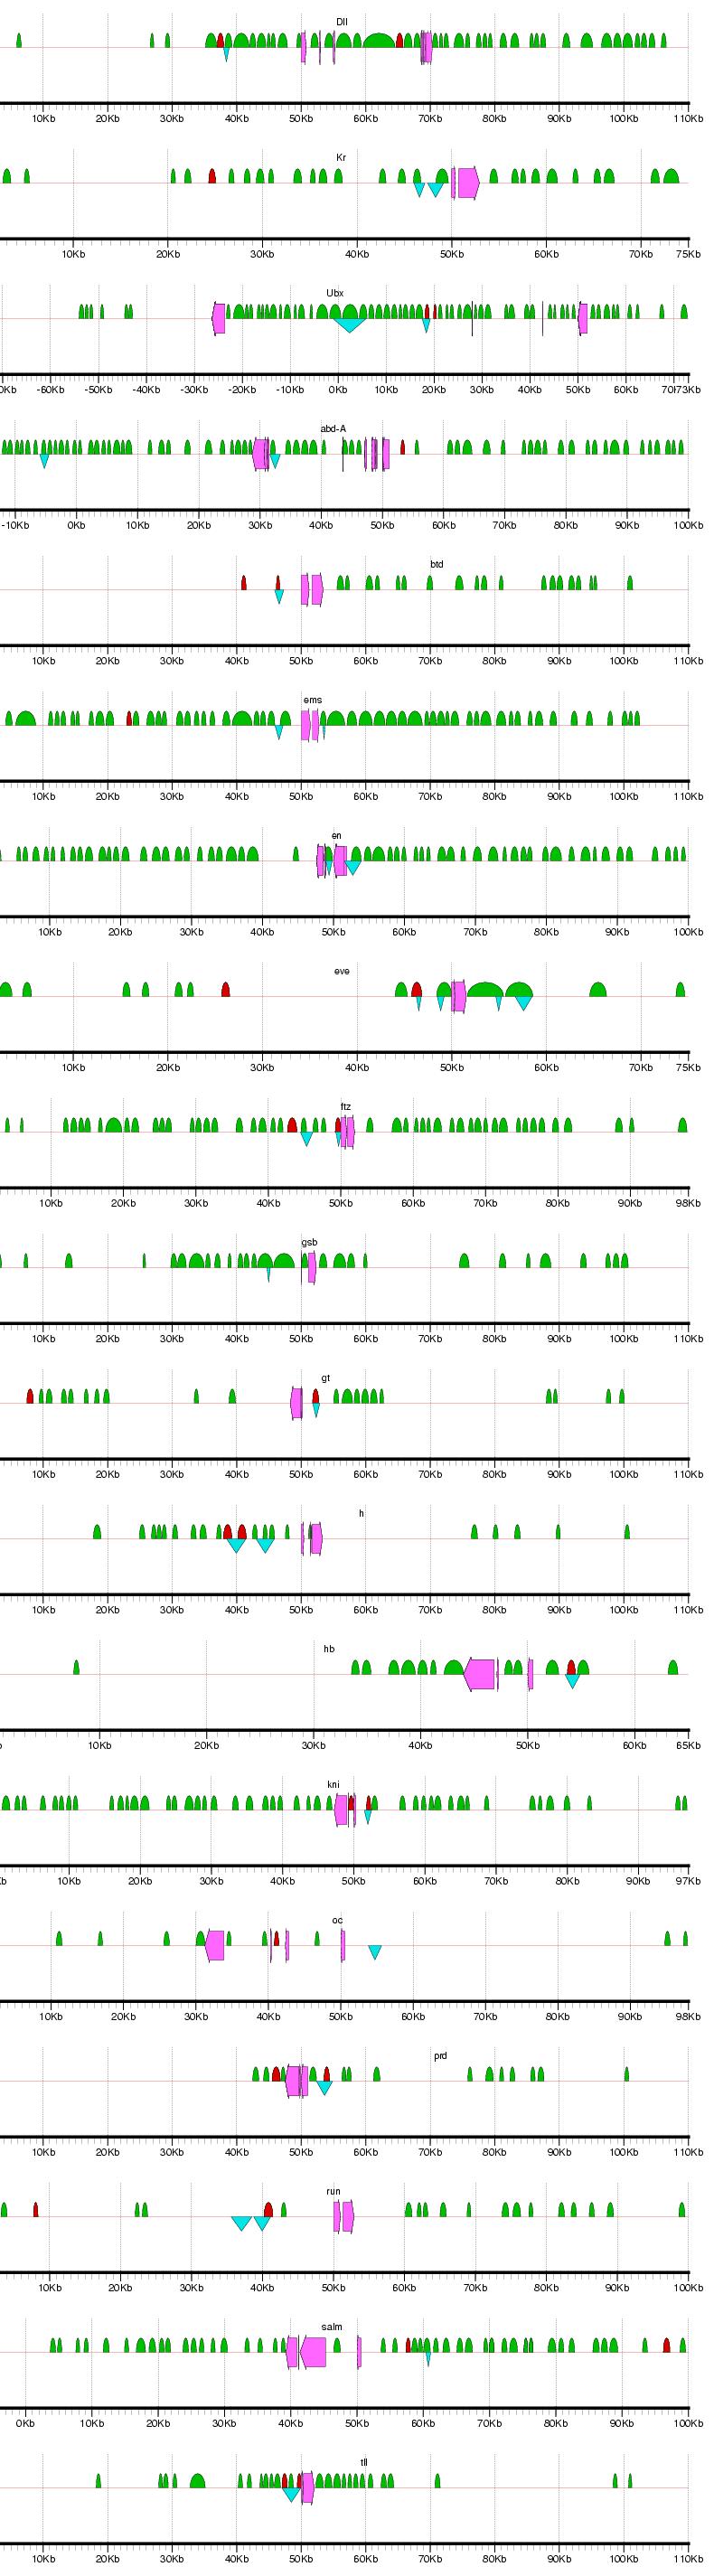
Figure 3: Several examples of blastodermally expressed genes denoted with results of PFR-Searcher, using the output from PFR-Sampler with input set c. Fuchsia arrows designate exons, blue triangles indicate known blastodermal enhancers (36), green semicircles indicate PFRs, red semicircles indicate PFRs comprising the output of the PFR-Sampler run, and yellow semicircles indicate PFRs with scores above threshold as determined by PFR-Searcher. Figure generated using gff2ps (Abril and Guigo 2000). Gene name abbreviations as in Figure 2. For full results, see Supplemental Figure 3.
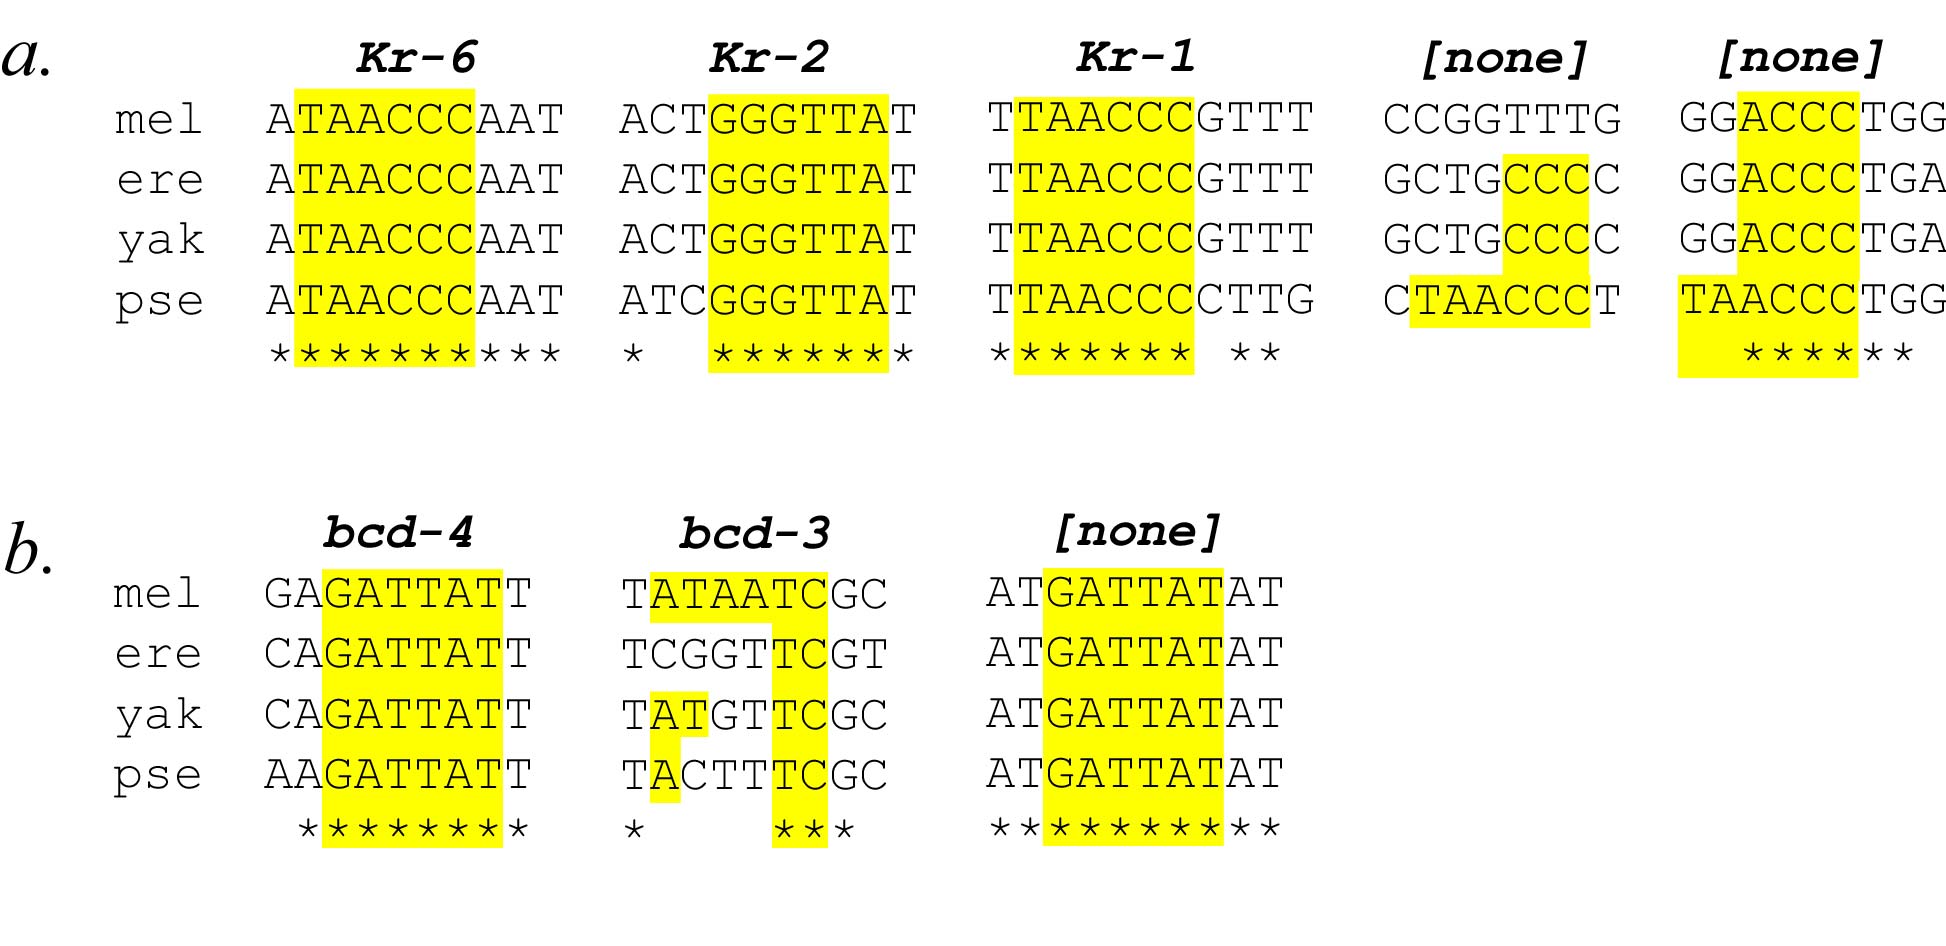
Figure 4: Top-scoring state transitions and their phylogenetic conservation in the PFR overlapping the eve stripe 2 element. Sequence from the stripe 2 element in D. melanogaster (mel), D. erecta (ere), D. yakuba (yak), and D. pseudoobscura (pse) were aligned by ClustalW (Higgins et al., 1994), and binding site information collated from Ludwig et al., 1998. Asterisks indicate columns of complete conservation in all four species. Regular expression matching identified locations of state transitions within the stripe 2 element sequence. a. Sites for state transition equivalent to TAACCC and its reverse complement GGGTTA appear within known Krüppel binding sites Kr-6, Kr-2, and Kr-1, along with two sites in the D. pseudoobscura stripe 2 region that are not well conserved in D. melanogaster. b. Sites for state transition equivalent to GATTAT and its reverse complement ATAATC appear within known Bicoid binding sites bcd-4 and bcd-3, as well as in a very well conserved block of sequence in the 3' region of the stripe 2 enhancer. See Supplemental Figure 4 for full mapping information.
Supplemental Figure 1: Complete results for PFR identification for loci surrounding the 19 blastodermally expressed genes. Abbreviations: Distalless - dll; Kruppel - Kr; Ultrabithorax - Ubx; abdonimal-A - abd-A; buttonhead - btd; empty spiracles - ems; engrailed - en; even skipped - eve; fushi tarazu - ftz; gooseberry - gsb; giant - gt; hairy - h; hunchback - hb; knirps - kni; ocelliless - oc; runt - run; spalt - salm; tailless - tll. The loci extend 50 kb flanking the start and stopping site of each gene, or to a midway point between two adjacent genes. Fuchsia arrows designate exons, blue triangles indicate known blastodermal enhancers, and green semicircles indicate PFRs. Figure generated using gff2ps (Abril and Guigo 2000).
Supplemental Figure 2: PFR-Sampler results for
set (a) -- 10 genes
set (b) -- 12 genes
set (c) -- 14 genes
set (d) -- 17 genes
set (e) -- 19 genes
Supplemental Figure 3: Complete results for PFR-Sampler and PFR-Searcher results using an input of 14 genes (set c; see legend to Figure 3 and text for details). Abbreviations as in Supplemental Figure 1 above.
Supplemental Figure 4: Mapping of top 15 state transitions to D. melanogaster eve stripe 2 element and phylogenetic comparison. Sequence of the eve stripe 2 element from D. melanogaster, D. pseudoobscura, D. erecta, and D. yakuba were aligned by ClustalW (Higgins et al., 1994), with manual adjustment where appropriate to keep intact known binding sites (based on Ludwig et al., 1998). Asterisks indicate columns of identity in all four species. Locations in D. melanogaster of state transitions and their reverse complements from the set of most informative 15 for the PFR overlapping this element are shown in yellow highlights, with highlight extending through all four species. Since the PFR is longer than the element, not all of the top state transitions are represented here. For a full list of the state transitions, their scores, and their frequencies, see Supplemental Table 3.
Table 1: Input sets of genes, composed of blastodermally expressed genes. (a) The core set of 10 genes, from Berman et al., 2002, which are included in all sets. (b-e) Additional sets of genes, of size 12, 14, 17, and 19 genes, respectively, randomly selected from a pool of blastodermally expressed genes. The gene loci include 50 kb upstream of the annotated start site and downstream of the annotated stop site for each gene (D. melanogaster Release 3.1 annotations), and the "locus length" column indicates the number of bp considered. The number of phylogenetic footprints (for parameters defining PFRs, see methods) within each of these loci is reported in the PFR column.
Table 2: Summary of output from PFR-Sampler given the five input sets described in Table 1. The score ("average rank") is an assessment of the similarity of output, where leave-one-out cross validation is performed on each of the output PFRs, and the rank out of 1000 randomly selected genes is determined; the average rank for each of the PFRs in the output set is reported here. For each input set, percentile is determined from the distribution of scores of 100 sets of randomly selected genes.
Supplemental Table 1: Results from PFR-Searcher scan of PFRs in D. melanogaster genome using the PFR-Sampler output from set "c" (described in text; see Figure 2 and Table 2). Input PFRs are designated in red. Gene names in bold indicate that expression data is available for these genes. If the gene name is underlined, expression data was garnered from FlyBase; else expression data was gleaned from the BDGP in situ database. The rightmost four columns indicate whether the gene is expressed in the early blastoderm in a segmentation-related pattern. A "y" indicates a positive; "n" negative; "?" unclear; and an "x" indicates that there are contradictory results between FlyBase annotation and the in situ images in the BDGP database.
Supplemental Table 2: List of all 4096 state-transitions (equivalent to all six mers); the seuqence score, meaning the score of the likelihood of observing a state-transition in the model derived from the 24 PFRs in the output from set "c" (see Figure 2 and Table 2) as compared to background.
Supplemental Table 3: List of all 4096 state transitions (equivalent to all six mers) ranked according to their contribution to the score of the PFR overlapping the eve stripe 2 element. The frequency of appearance of a state transition - its counts - multiplied by the log-likelihood score give its contribution to the overall score of the PFR. Overlap with known and characterized transcription factors is also reported; for mapping back to the stripe 2 element, see Supplemental Figure 3.
GFF data for each of the 19 genes used in this study, including the results from the PFR-Sampler run starting with set c and the subsequent PFR-Searcher run using the resulting model can be found here.
Source codes that can be compiled under UNIX are available here.
To compile the source code for UNIX, use the following command:
gcc -lm -o sampler sampler.c
gcc -lm -o searcher searcher.c
Copyright (c) 2004 by Yonatan Grad and the President and Fellows of Harvard University
Please contact Yonatan Grad.