E.coli Proteomics: Subcellular localization, abundance, protein sequence,
ESI-MS,
2D Gels
Back to the Church Lab Home Page
Text and Data from
both Andy Link's 1994 Harvard University Thesis, "Experimental Tools for
the Analysis of Genomes"...
AND
" Link, A.J., Robison, K. and Church, G.M. (1997) Comparing the predicted
and observed properties of proteins encoded in the genome of Escherichia
coli." Electrophoresis 18:1259-1313 (special proteome issue)."
The experimental tools of two-dimensional electrophoresis
and N-terminal protein sequencing are combined to survey the protein content
of E. coli. The observed isoelectric point and molecular weight are precisely
measured from the mobilities of proteins on 2-DE gels, and the relative
abundance of each protein is estimated from the intensity of the stained
spot. Using cellular fractionation techniques allows the cellular location
of proteins to be determined. Limited sequence of the amino terminus of
each protein produces a query sequence for identifying the protein and
marks the mature protein start site. A second estimate of protein abundance
is obtained from the initial yield of each sequence tag.
Another protein characterization of E. coli has been underway
for over a decade to create an index linking a gene to its protein product
on a reference 2-DE gel and to monitor changing global protein expression
as a function of cellular environment (Neidhardt et al., 1983). This group
has been annotating the proteins displayed on 2-DE gels by cataloging the
observed isoelectric point, molecular weight, abundance, and regulatory
information, and have primarily used migration of known proteins with radiolabeled
total cell extracts to identify the spots on the reference 2-DE gel (Block
et al., 1980; Phillips et al., 1980; Neidhardt et al., 1983; Phillips et
al., 1988; VanBogelen et al., 1990; VanBogelen and Neidhardt, 1991; VanBogelen
et al., 1992).
Our project uses protein sequencing to identify and quantitate
the protein products of the E. coli genome. The protein data complements
the genomic DNA sequence by identifying open reading frames being expressed
and measuring the accumulated protein in E. coli. Using protein sequencing
of 2-DE spots, the colinearity of DNA sequence and protein sequence is
compared to look for deviations from the code. The observed isoelectric
point and molecular weight of each identified protein is compared to values
predicted by genomic sequence data to identify proteins with unexpected
electrophoretic mobilities. The abundance of identified proteins is compared
to the expected protein content of the cell.
-
Tables: (note: the
legend for a1-a10 can also be found on Table a1)
-
Table 1: The
observed N-terminus of 233 E. coli genes
-
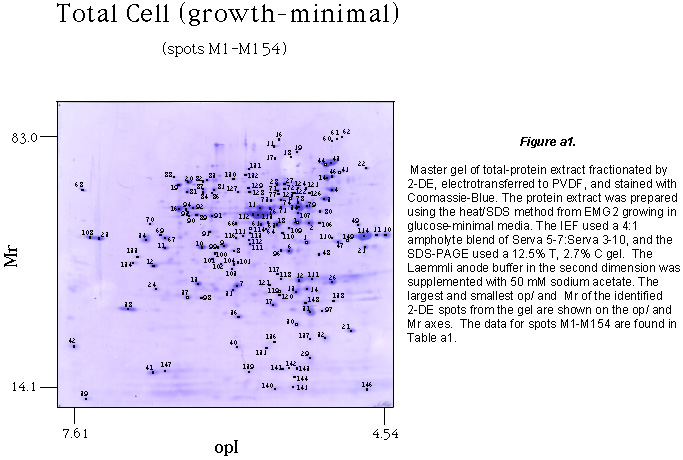
Table_a1: Growth
phase, minimal media E. coli proteins from a SDS/heat extract
-
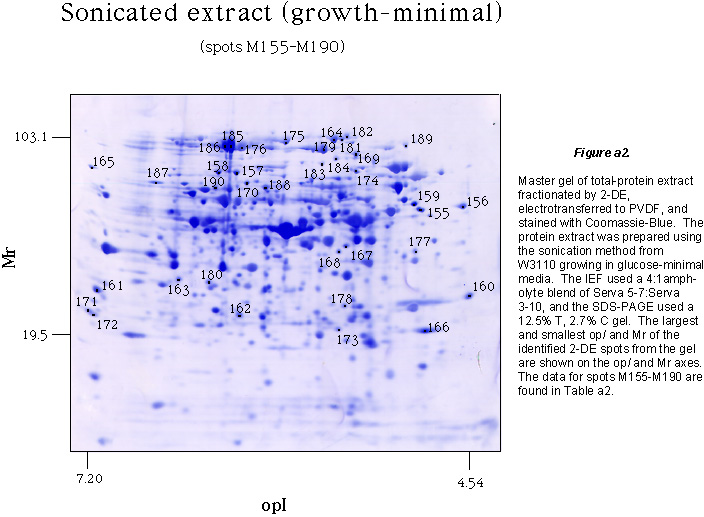
Table_a2: Growth-phase,
minimal-media E. coli proteins from a sonicated cell extract
-
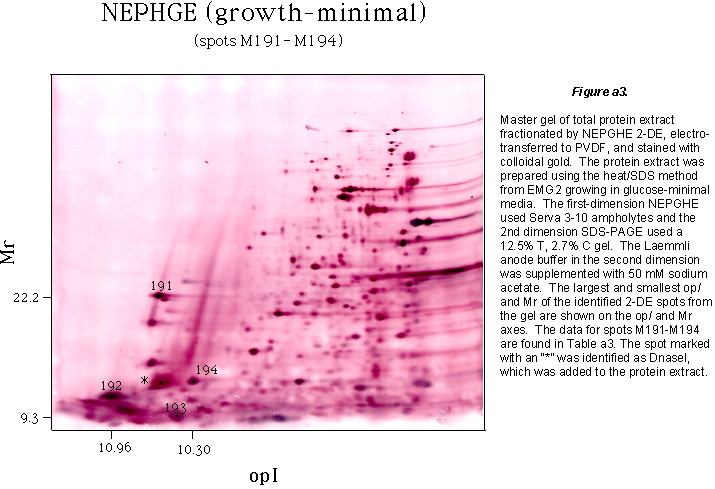
Table_a3: Growth-phase,
minimal media E. coli proteins analyzed using NEPHGE for the 1st dimension
-
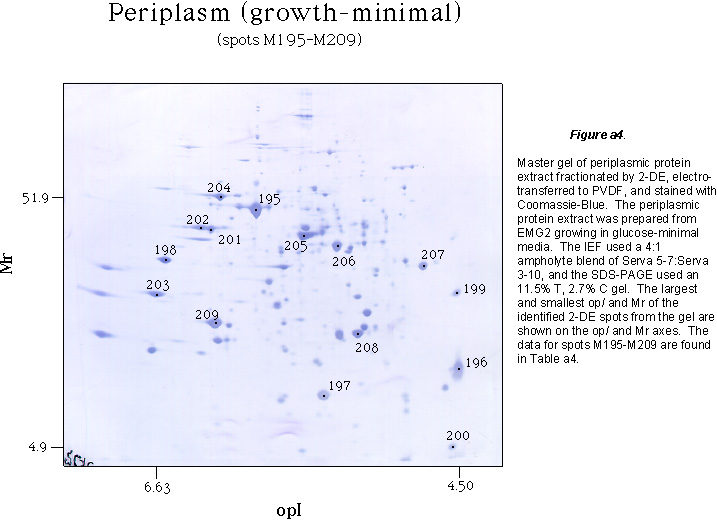
Table_a4: Periplasmic-enriched
E. coli proteins from cells harvested in growth phase, minimal media
-
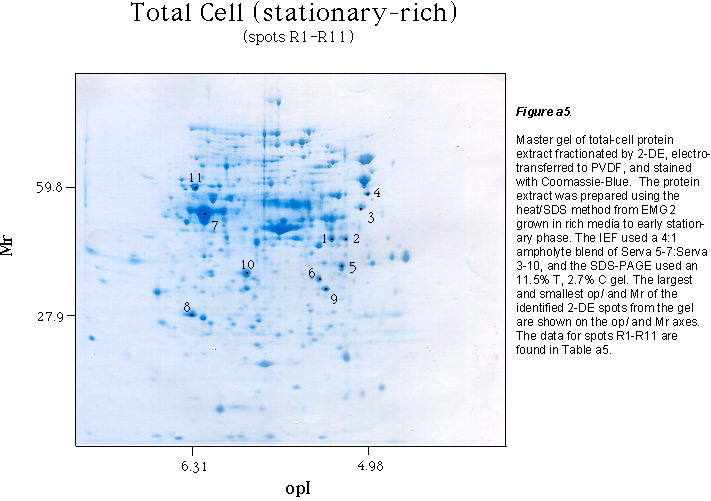
Table_a5: Stationary-phase,
rich-media E. coli proteins from an SDS/heat extract
-
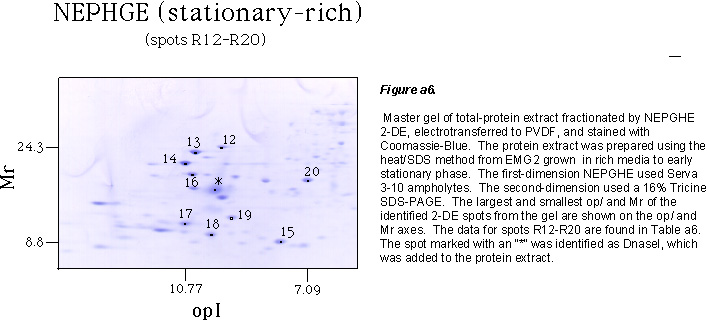
Table_a6: Stationary-phase,
rich-media E. coli proteins analyzed using NEPHGE for the 1st dimension
-
Table_a7: Low-molecular-mass
E. coli proteins from cells at early stationary phase in rich media
-
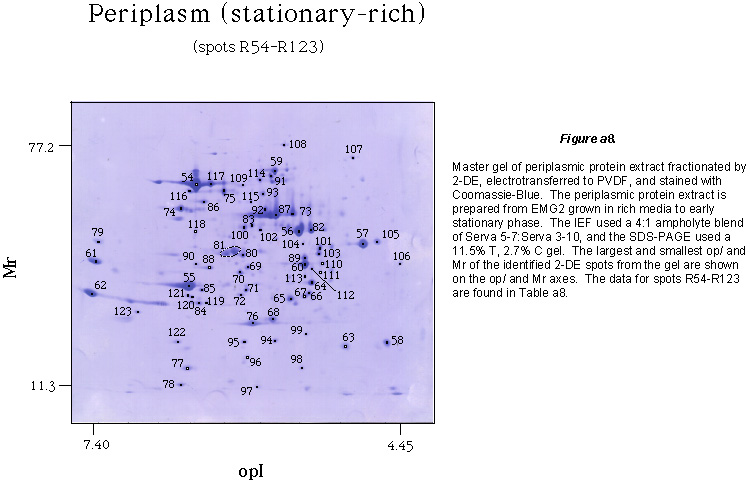
Table_a8: Periplasmic-enriched
E. coli proteins from cells at stationary phase in rich media
-
Table_a9: Inner-membrane-enriched
E. coli proteins from cells at stationary phase in rich media
-
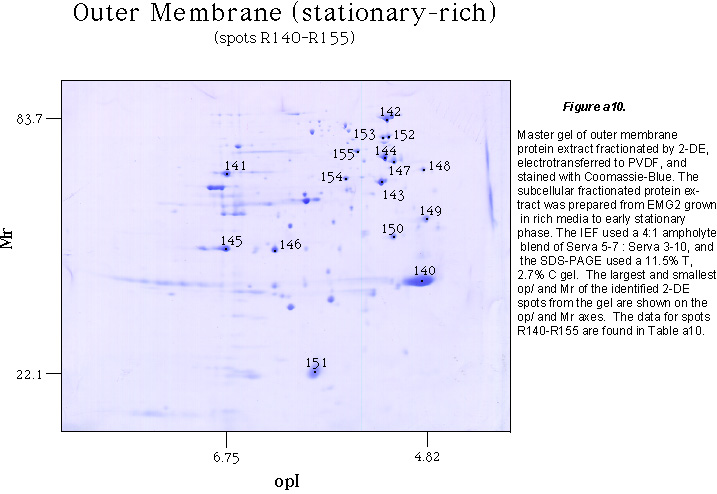
Table_a10:
Outer-membrane-enriched E. coli proteins from cells at stationary phase
in rich media
-
Figures a1 through a10
-
Old tables versions in excel text fornat
Protein Mass-spectrometry links:
This page was last updated 20-Jan-1999 by GMC. reyes@arep.med.harvard.edu